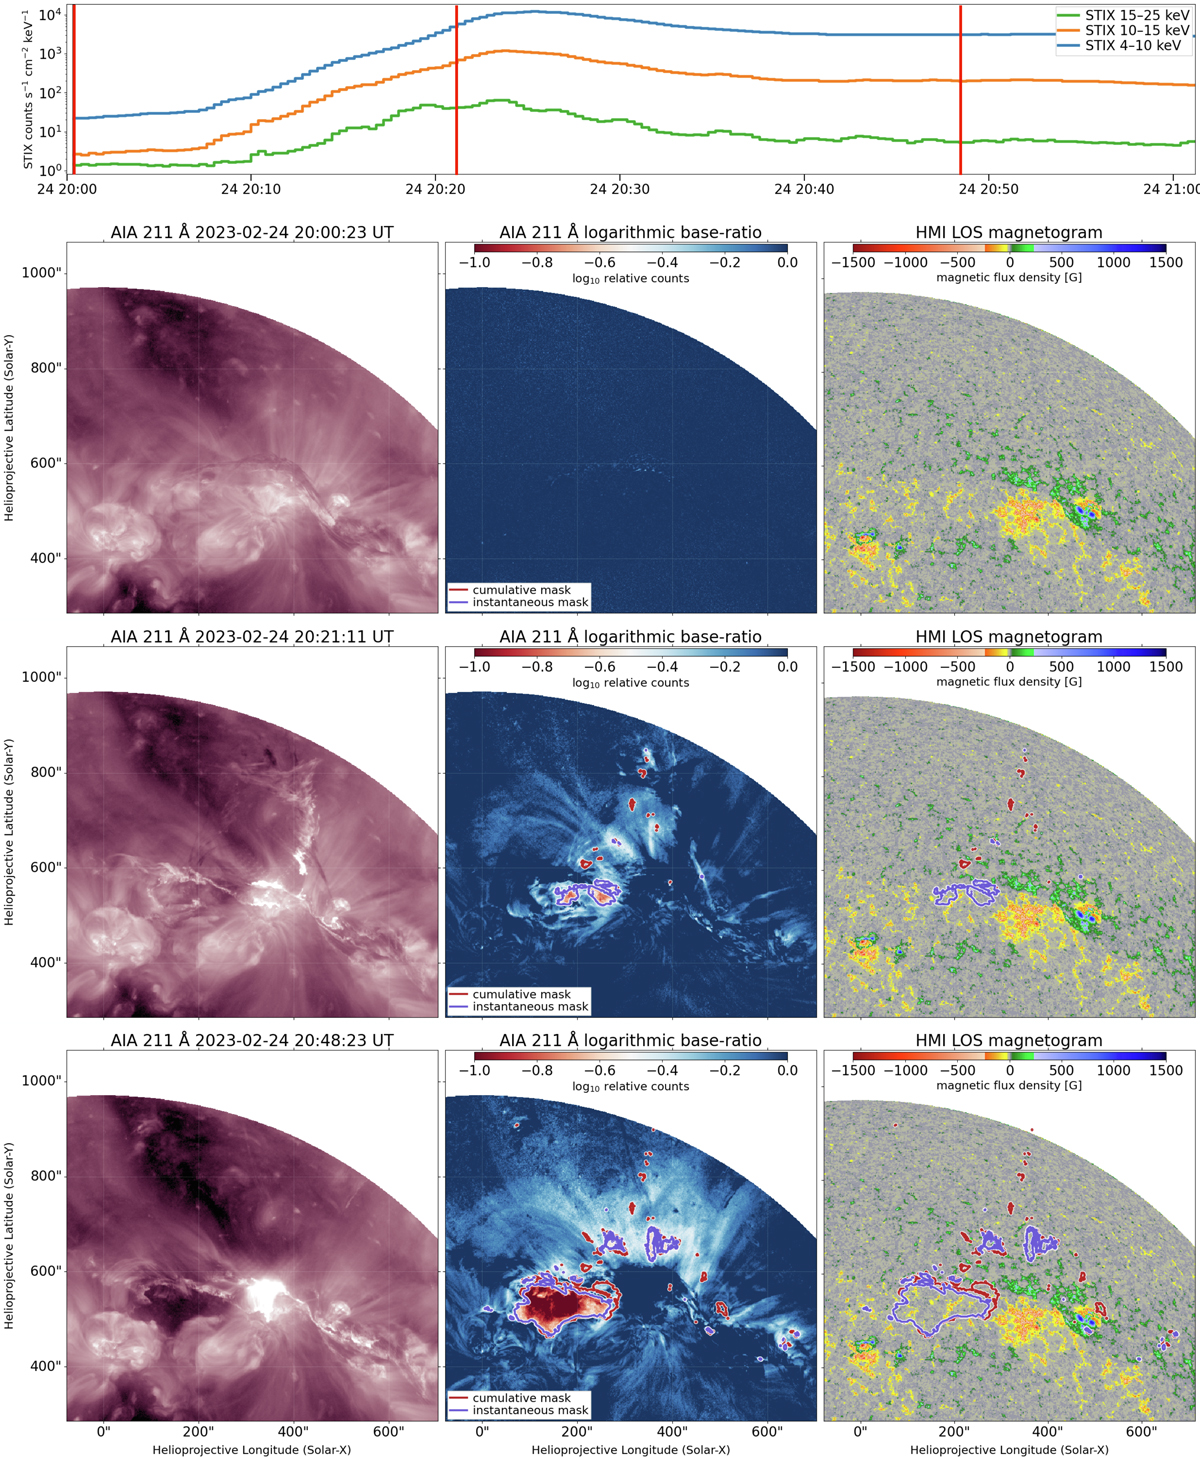
Fig. 3.
Download original image
Evolution of the coronal dimming associated with the filament eruption. Upper panel: Time series of STIX counts in three different energy bands. The selected observation times are marked by the red vertical lines. Bottom panels: Selected observation times. Each row corresponds to one time and shows the AIA 211 Å image from that time, the derived LBR map (the base time is 20:00 UT) with instantaneous and cumulative dimming masks (threshold: LBR = −0.5 log10 relative counts), and the HMI LOS magnetogram from 20:00 UT with the same dimming mask contours. The associated movie is available online.
Current usage metrics show cumulative count of Article Views (full-text article views including HTML views, PDF and ePub downloads, according to the available data) and Abstracts Views on Vision4Press platform.
Data correspond to usage on the plateform after 2015. The current usage metrics is available 48-96 hours after online publication and is updated daily on week days.
Initial download of the metrics may take a while.