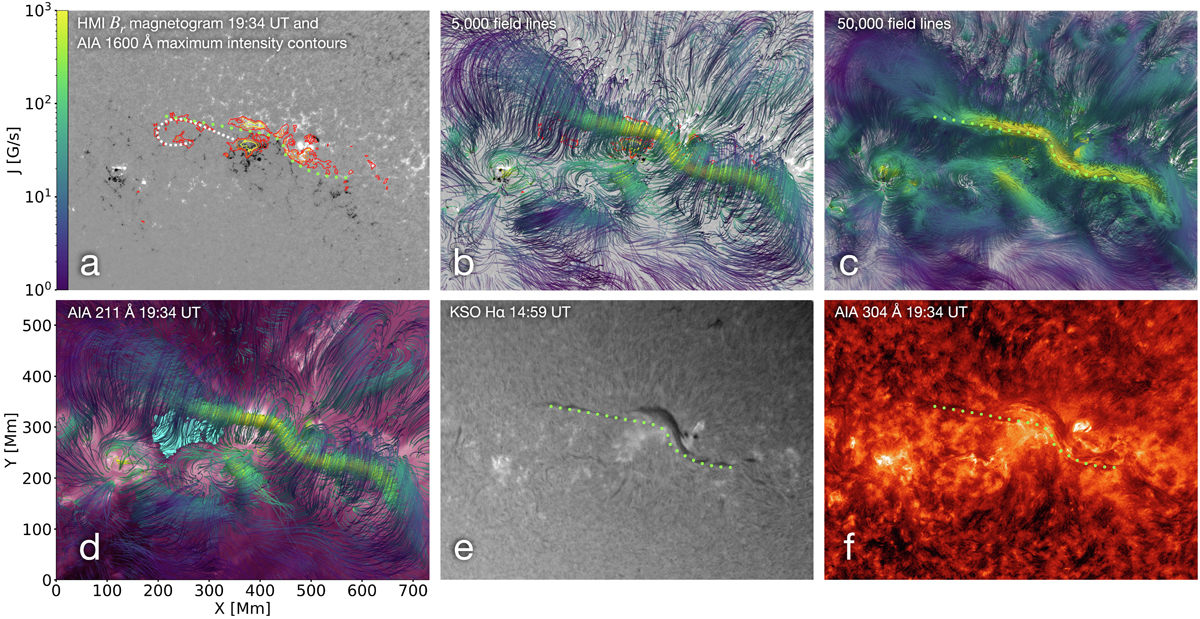
Fig. 5.
Download original image
Overview of NLFFF extrapolation results and comparison with observations reprojected to the CEA coordinate frame of the extrapolation. (a) HMI Br magnetogram. The contours show the maximum brightness of flare ribbons in a series of AIA 1600 Å images between 20:00 and 20:45 UT. The contour levels are 25, 100, and 400 DN/s. (b) 5000 field lines randomly started from the lower boundary of the extrapolation volume with the HMI LOS magnetogram and AIA 1600 Å contours as background. The field lines are color-coded according to the local current density. Regions of low current density are made increasingly transparent to keep the underlying high current density filament channel visible. (c) Same as b, but with 50 000 field lines. (d) 5000 field lines with the AIA 211 Å image showing the dimming as a background. The dimming area is marked by a cyan mask. (e and f) reprojected KSO Hα and AIA 211 Å images for reference. The locations of the PIL (green dotted) and inverse J-shaped flare ribbon (white dashed) are indicated on some panels. The movie accompanying this figure shows a smooth transition between the NLFFF extrapolation and the AIA 304 Å and KSO Hα images. The movie is available online.
Current usage metrics show cumulative count of Article Views (full-text article views including HTML views, PDF and ePub downloads, according to the available data) and Abstracts Views on Vision4Press platform.
Data correspond to usage on the plateform after 2015. The current usage metrics is available 48-96 hours after online publication and is updated daily on week days.
Initial download of the metrics may take a while.