Fig. 6.
Download original image
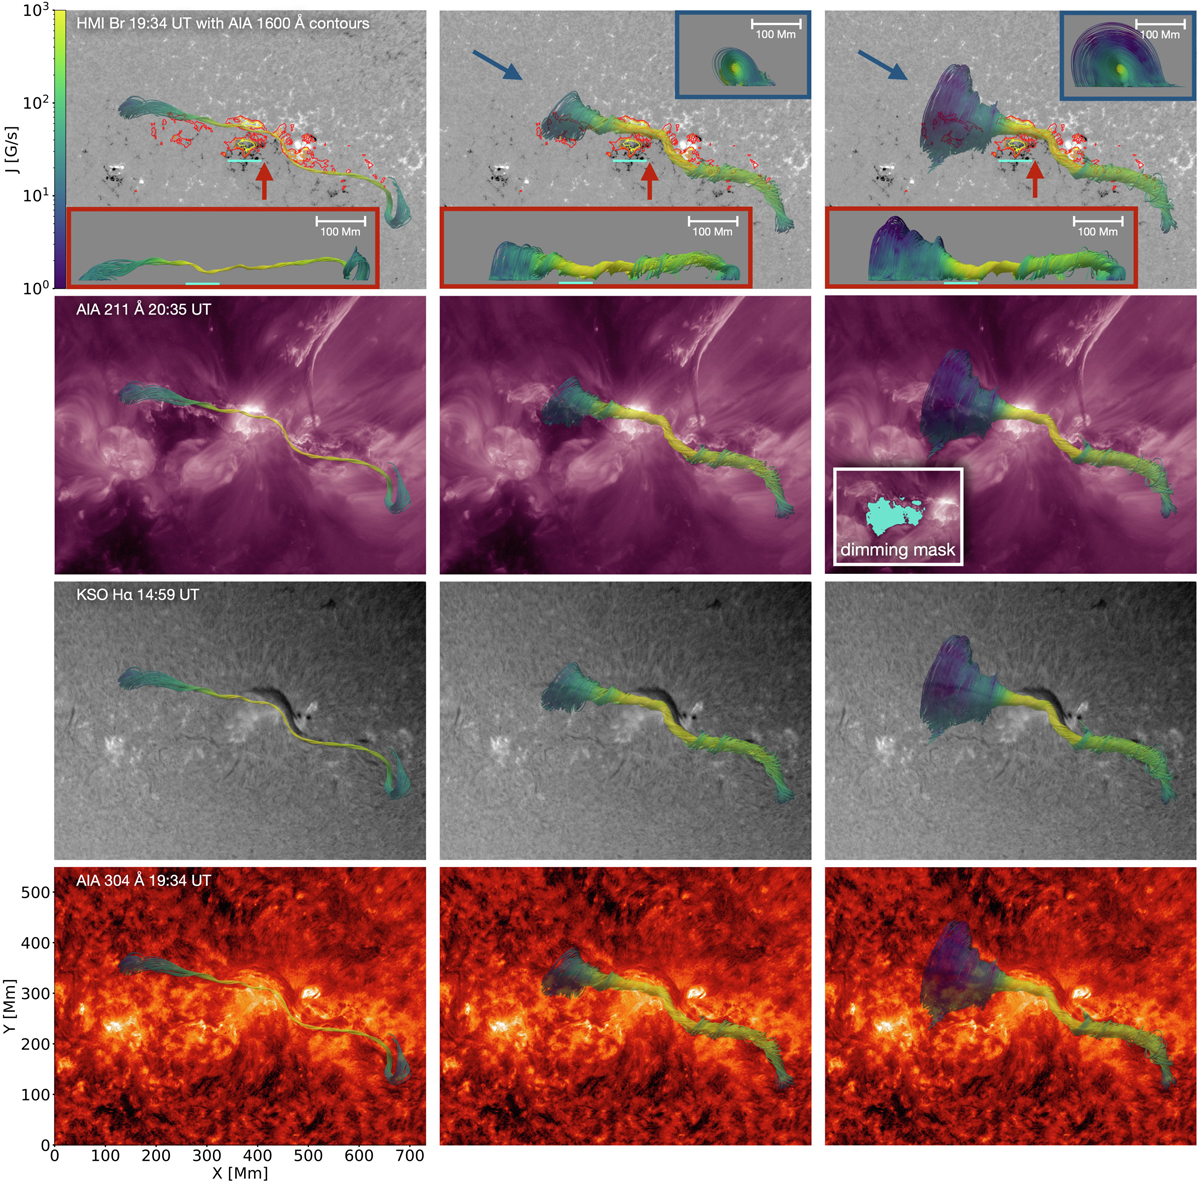
Field lines associated with the core of the MFR (left column), the inverse J-shaped ribbon (middle column), and the coronal dimming region (right column). The field lines start from a single circular seed source at the eastern end of the shown structure (left column); from multiple circular seed sources covering the area inside the inverse J-shaped ribbon, as suggested by the maximum AIA 1600 Å contours (middle column); and from inside the dimming region, as determined by all pixels below the threshold of −0.5 in the logarithmic AIA 211 Å base ratio image of 20:35 UT (see Sect. 3.2 for more details). Each field structure is compared with the HMI Br magnetogram from the NLFFF extrapolation time (top row). Side views from the direction of the colored arrows (red and blue) are shown in the insets. The cyan line roughly indicates the extent of the main part of the flare ribbons. The field structures are compared with the AIA 211, 304 Å, and KSO Hα observations. The dimming mask used as a seed source is shown in the inset of the AIA 211 Å observation.
Current usage metrics show cumulative count of Article Views (full-text article views including HTML views, PDF and ePub downloads, according to the available data) and Abstracts Views on Vision4Press platform.
Data correspond to usage on the plateform after 2015. The current usage metrics is available 48-96 hours after online publication and is updated daily on week days.
Initial download of the metrics may take a while.