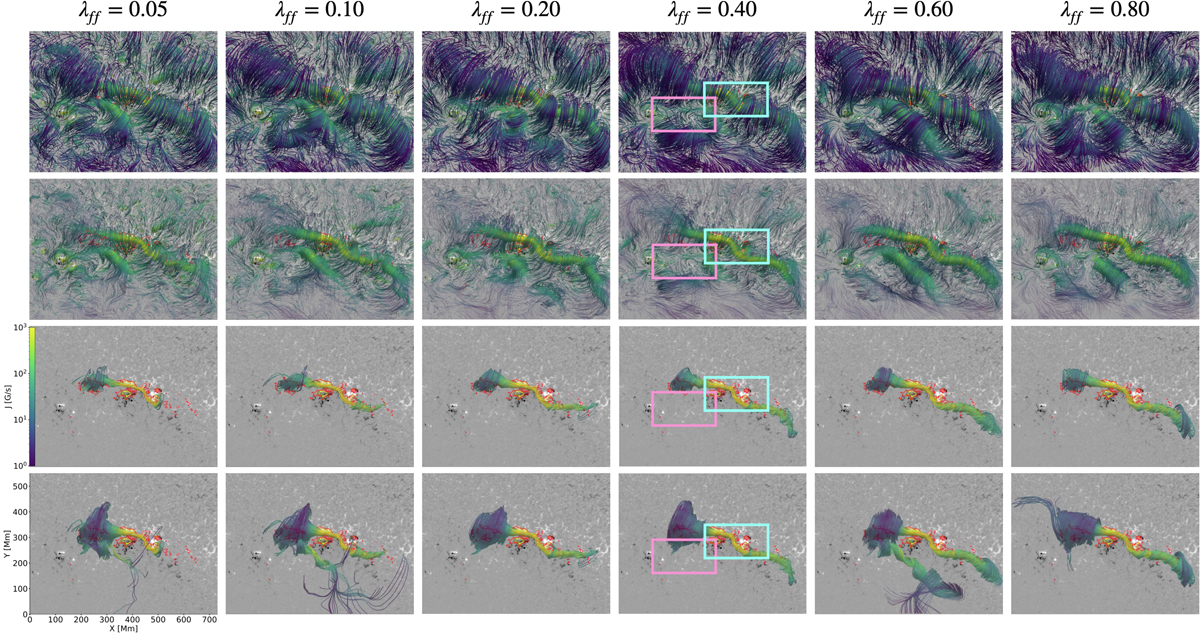
Fig. A.2.
Download original image
Comparison of field lines in selected extrapolations from the ensemble. First row: Field lines randomly sampled from the entire bottom boundary. Second row: Same as above, but the low current density regions are transparent. Third row: Field lines corresponding to the area inside the J-shaped flare ribbon. Bottom row: Field lines corresponding to the dimming region as defined by all pixels below the threshold of −0.5 in the logarithmic AIA 211 Åbase ratio image of 20:35 UT (see Sect. 3.2 for more details). In the visualizations of λff = 0.4, two subregions are marked that correspond to the subregions for which the quality metrics given in Table A.1 were calculated.
Current usage metrics show cumulative count of Article Views (full-text article views including HTML views, PDF and ePub downloads, according to the available data) and Abstracts Views on Vision4Press platform.
Data correspond to usage on the plateform after 2015. The current usage metrics is available 48-96 hours after online publication and is updated daily on week days.
Initial download of the metrics may take a while.