Fig. 1
Download original image
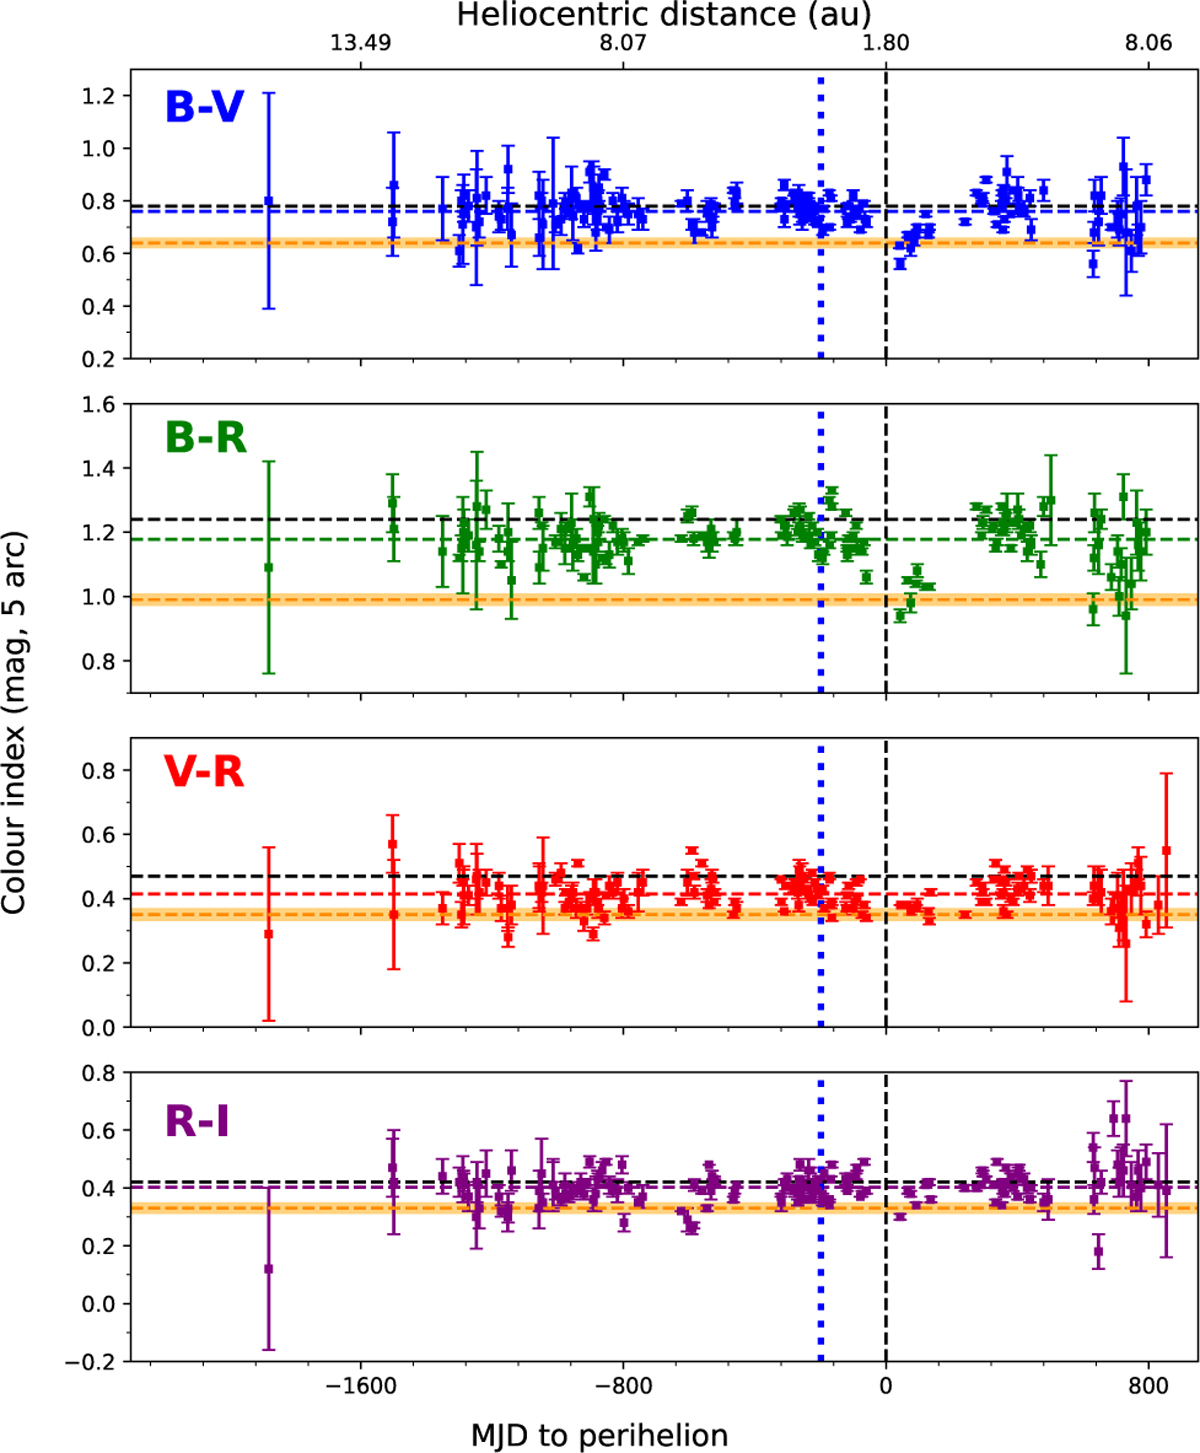
B-V, B-R, V-R, and R-I colors of C/2017 K2 vs. time to perihelion and heliocentric distance, with the mean values from Table 4 compared with the average value of 25 active LPC from Jewitt (2015) (horizontal dashed black lines), and the Sun colors from Holmberg et al. (2006) (horizontal dashed orange lines). The vertical dashed line represents the perihelion, and the vertical dotted blue line represents the water-ice sublimation boundary (~3 au).
Current usage metrics show cumulative count of Article Views (full-text article views including HTML views, PDF and ePub downloads, according to the available data) and Abstracts Views on Vision4Press platform.
Data correspond to usage on the plateform after 2015. The current usage metrics is available 48-96 hours after online publication and is updated daily on week days.
Initial download of the metrics may take a while.