Fig. B.1
Download original image
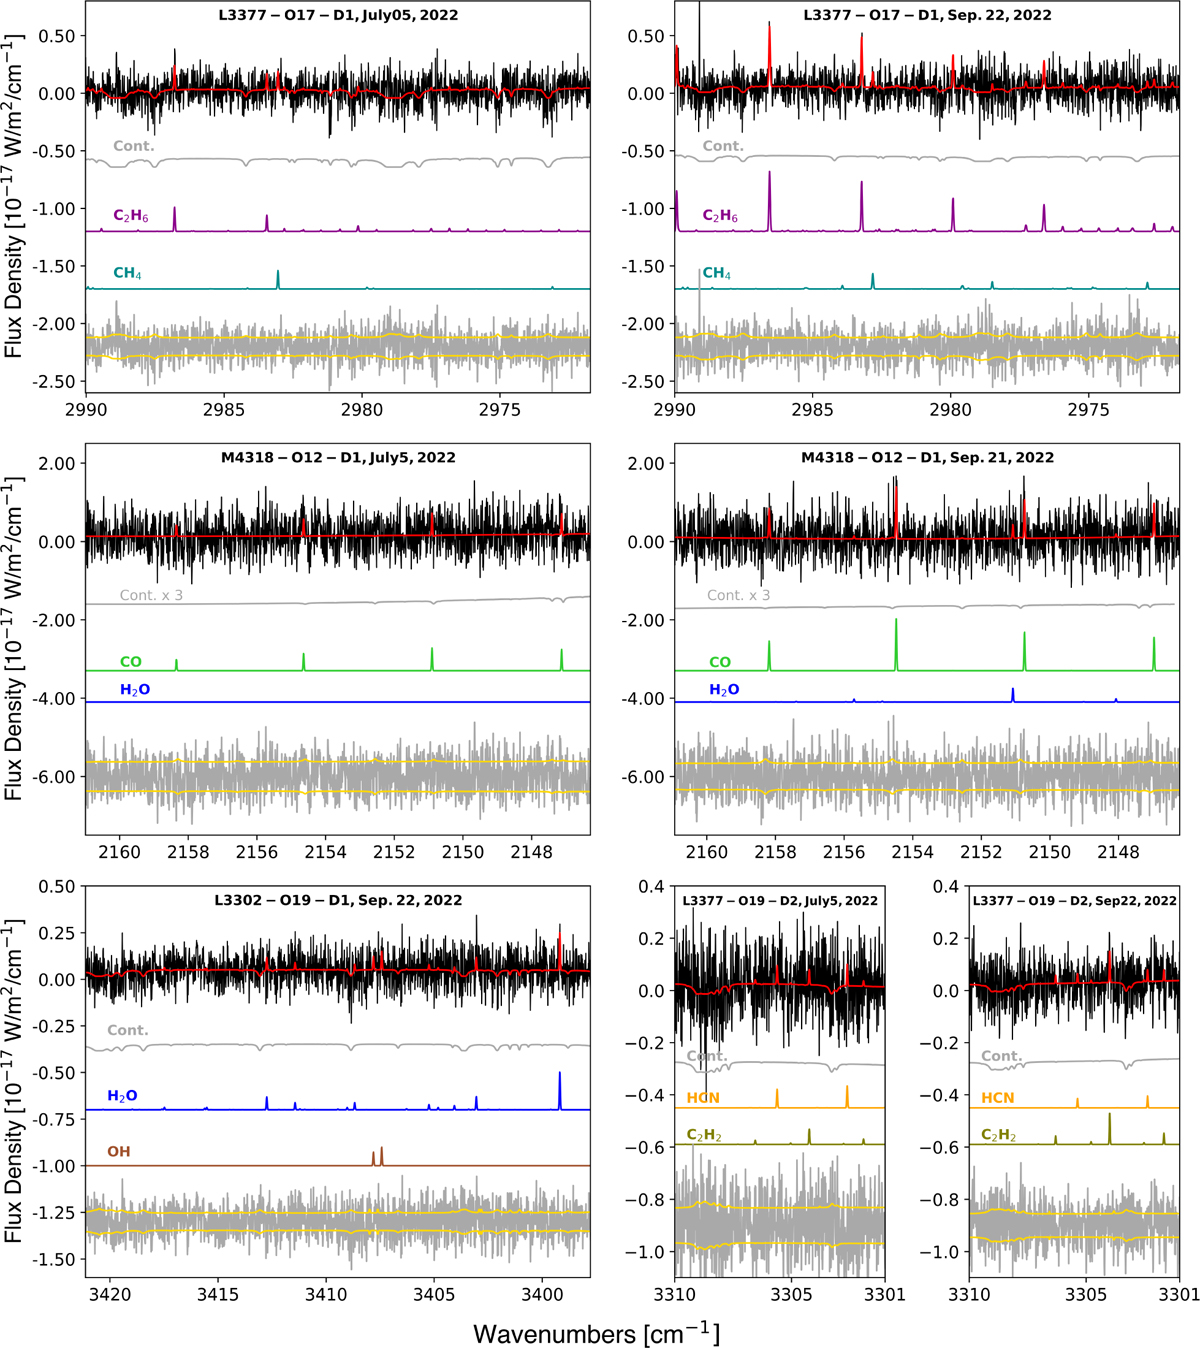
Spectra of comet C/2017 K2 acquired with CRIRES+. In each plot, the top spectrum shows the observed data along with the total model (in red), while the gray spectrum below represents the modeled transmittance. Molecular models used to derive the production rates are displayed in different colors and labeled accordingly. Residuals are shown at the bottom in gray, with yellow lines indicating the ±1σ uncertainties. Setting, detector number, and observing date are shown on top of each plot.
Current usage metrics show cumulative count of Article Views (full-text article views including HTML views, PDF and ePub downloads, according to the available data) and Abstracts Views on Vision4Press platform.
Data correspond to usage on the plateform after 2015. The current usage metrics is available 48-96 hours after online publication and is updated daily on week days.
Initial download of the metrics may take a while.