Open Access
Fig. 2
Download original image
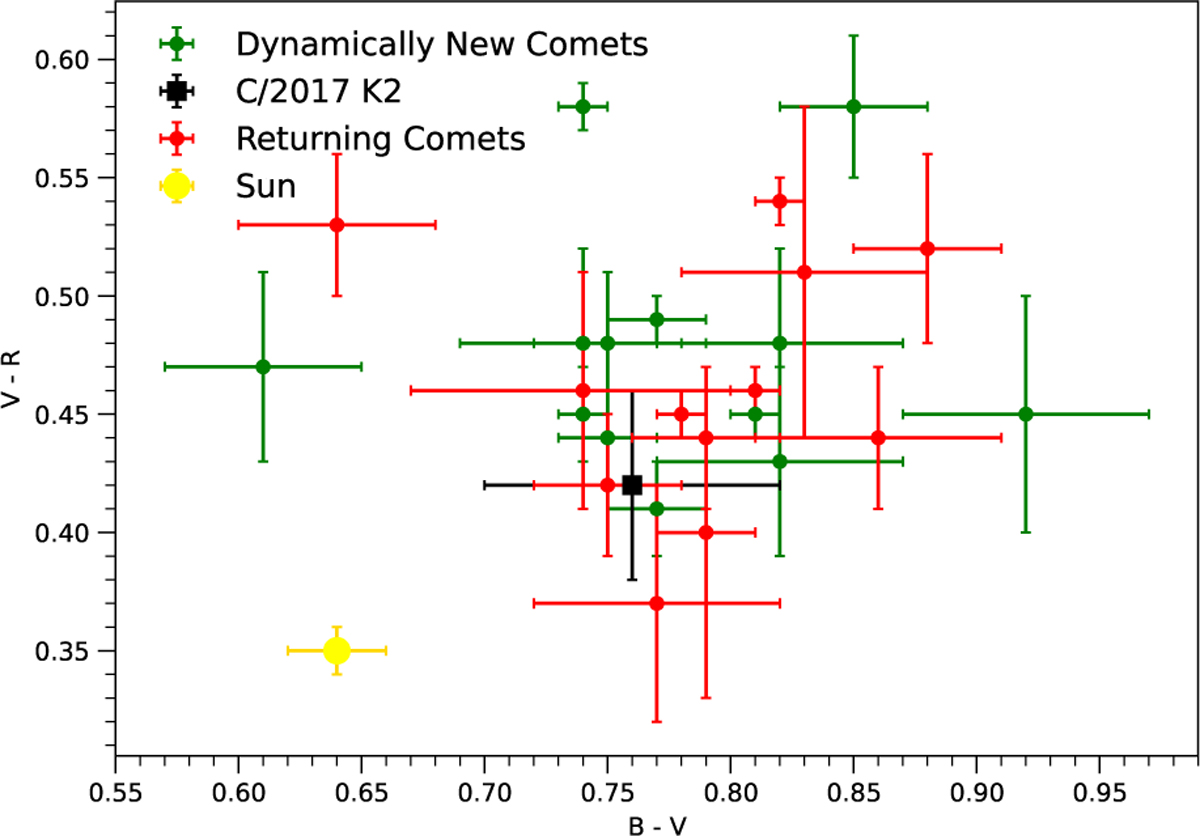
Color–color plot comparing C/2017 K2 (square) with dynamically new comets (green) and returning comets (red) from Jewitt (2015). The color of the Sun is marked by a yellow circle.
Current usage metrics show cumulative count of Article Views (full-text article views including HTML views, PDF and ePub downloads, according to the available data) and Abstracts Views on Vision4Press platform.
Data correspond to usage on the plateform after 2015. The current usage metrics is available 48-96 hours after online publication and is updated daily on week days.
Initial download of the metrics may take a while.