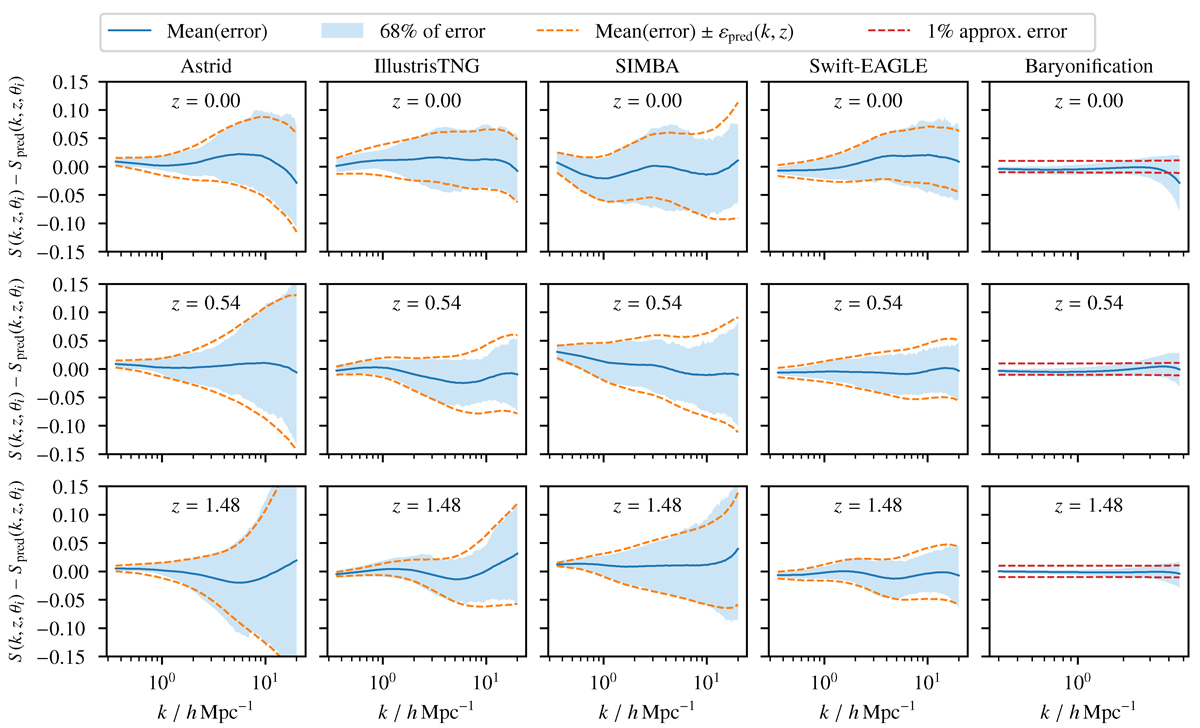
Fig. 2.
Download original image
Difference between the symbolic fits for the baryonic effect on the power spectrum (Spred) to the true values (S) from the test set. Each column is for a different baryonic model, and each row is for a different redshift, z. The solid lines indicate the mean difference and the shaded region contains 68% of samples. In the dashed orange lines we show the symbolic fits to the error on our models, as given in Table 4. This error is due to a combination of stochasticity in the simulation and imperfect symbolic approximations. The dashed red line in the baryonification model shows the approximate 1% intrinsic error of the BACCO emulator.
Table 4.
Chosen model for the error on baryonic correction to the power spectrum as a function of wavenumber k and redshift z.
Current usage metrics show cumulative count of Article Views (full-text article views including HTML views, PDF and ePub downloads, according to the available data) and Abstracts Views on Vision4Press platform.
Data correspond to usage on the plateform after 2015. The current usage metrics is available 48-96 hours after online publication and is updated daily on week days.
Initial download of the metrics may take a while.