Fig. B.1
Download original image
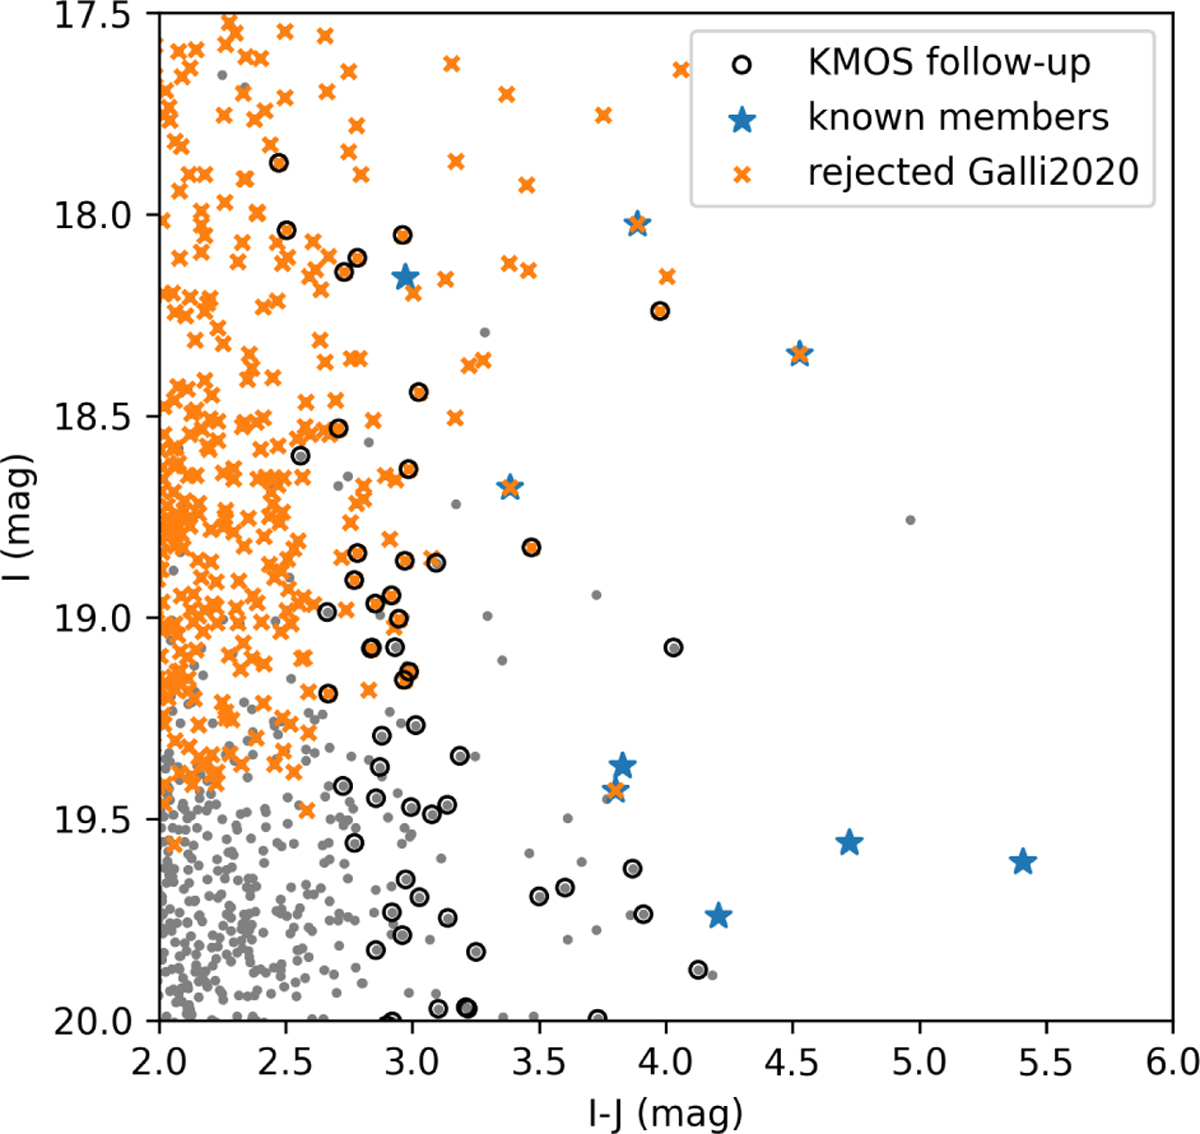
Zoom into the CMD region with an overlap of the KMOS follow-up with Gaia data. The sources in our catalog are shown as grey dots, previously confirmed members from astrometry, spectroscopy, mid-infrared excess, or X-ray emission as blue stars (Peterson et al. 2011; Galli et al. 2020a; Esplin & Luhman 2022), and objects rejected in (Galli et al. 2020a) as orange crosses. The sources with spectroscopy with KMOS are marked with black circles.
Current usage metrics show cumulative count of Article Views (full-text article views including HTML views, PDF and ePub downloads, according to the available data) and Abstracts Views on Vision4Press platform.
Data correspond to usage on the plateform after 2015. The current usage metrics is available 48-96 hours after online publication and is updated daily on week days.
Initial download of the metrics may take a while.