Fig. 5
Download original image
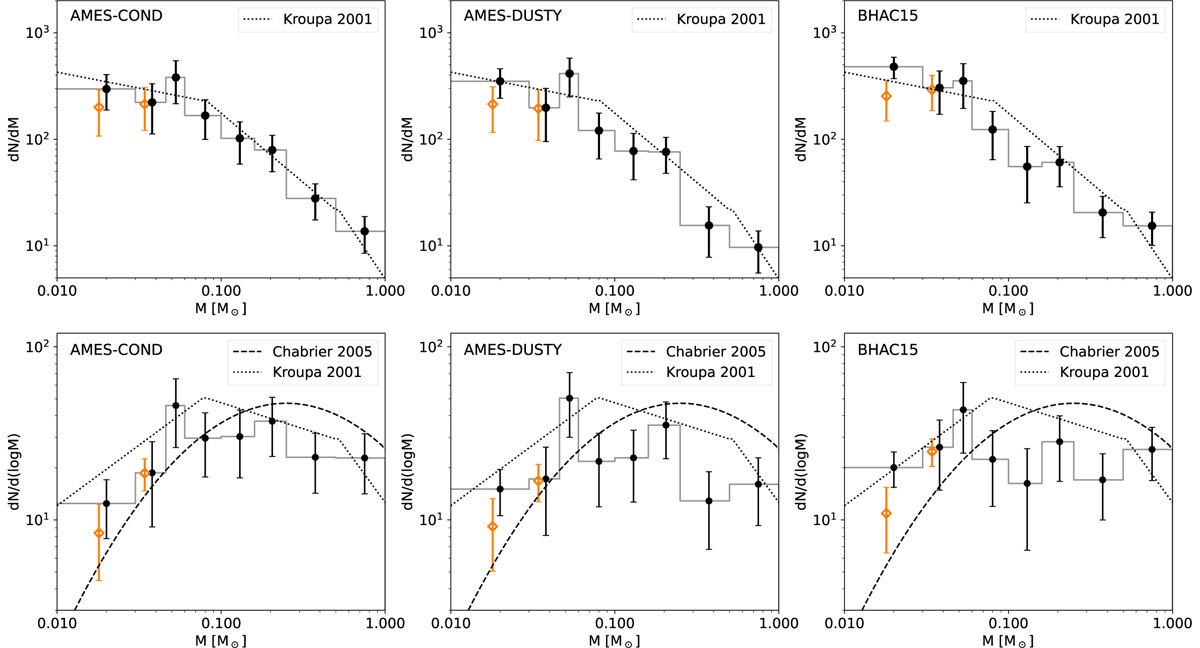
IMF in CrA in the power-law (top panels) and the log-normal form (bottom panels). The masses were derived using three different 3 Myr evolutionary models, indicated in the upper left corner of each panel. The black symbols and the gray histogram represent the IMF after correcting for the missing objects, and the orange points indicate the two affected bins before this correction. The orange points were slightly shifted to the left of the black points for clarity; the bin centers and sizes were maintained. Two different IMF representations are shown: dN/dm (top panels) and dN/dlog(m) (bottom panels). The dotted line shows the Kroupa segmented power-law mass function (Kroupa 2001), and the dashed line shows the Chabrier mass function (Chabrier 2005), both normalized to match the total number of objects in the cluster.
Current usage metrics show cumulative count of Article Views (full-text article views including HTML views, PDF and ePub downloads, according to the available data) and Abstracts Views on Vision4Press platform.
Data correspond to usage on the plateform after 2015. The current usage metrics is available 48-96 hours after online publication and is updated daily on week days.
Initial download of the metrics may take a while.