Fig. 7
Download original image
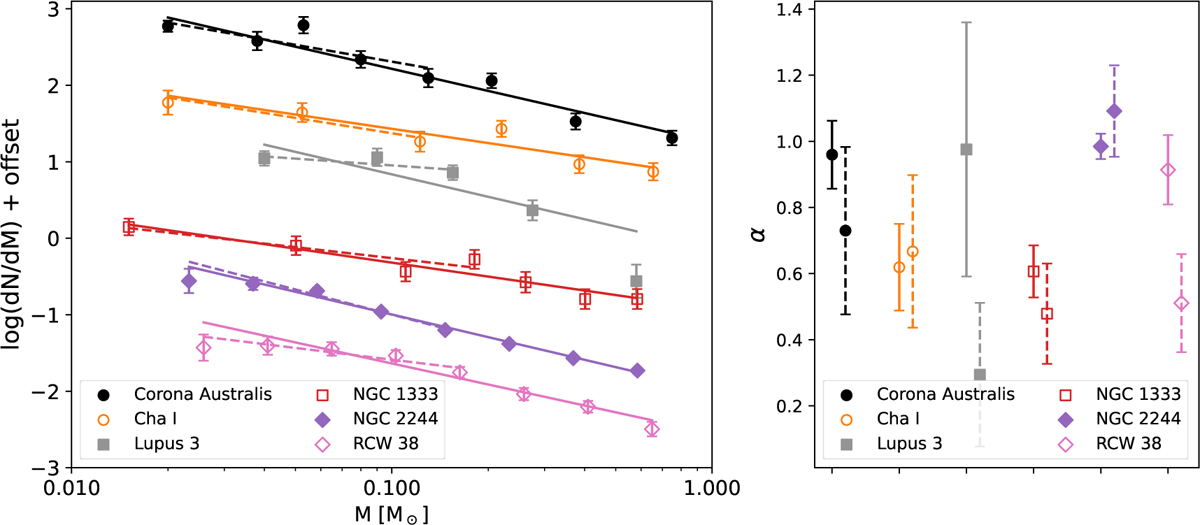
Left: comparison of the IMFs below 1 M⊙ in six different SFRs. The IMF for CrA is the mean of the IMFs presented in Section 4.3. The solid lines represent fits to the full set of data points for each cluster, and the dashed lines indicate fits restricted to the substellar regime below 0.2 M⊙. Right: IMF slope α corresponding to the fits displayed in the left panel, indicated using matching line styles. Table 3 lists the values shown in this panel, along with the references.
Current usage metrics show cumulative count of Article Views (full-text article views including HTML views, PDF and ePub downloads, according to the available data) and Abstracts Views on Vision4Press platform.
Data correspond to usage on the plateform after 2015. The current usage metrics is available 48-96 hours after online publication and is updated daily on week days.
Initial download of the metrics may take a while.