Open Access
Fig. 9
Download original image
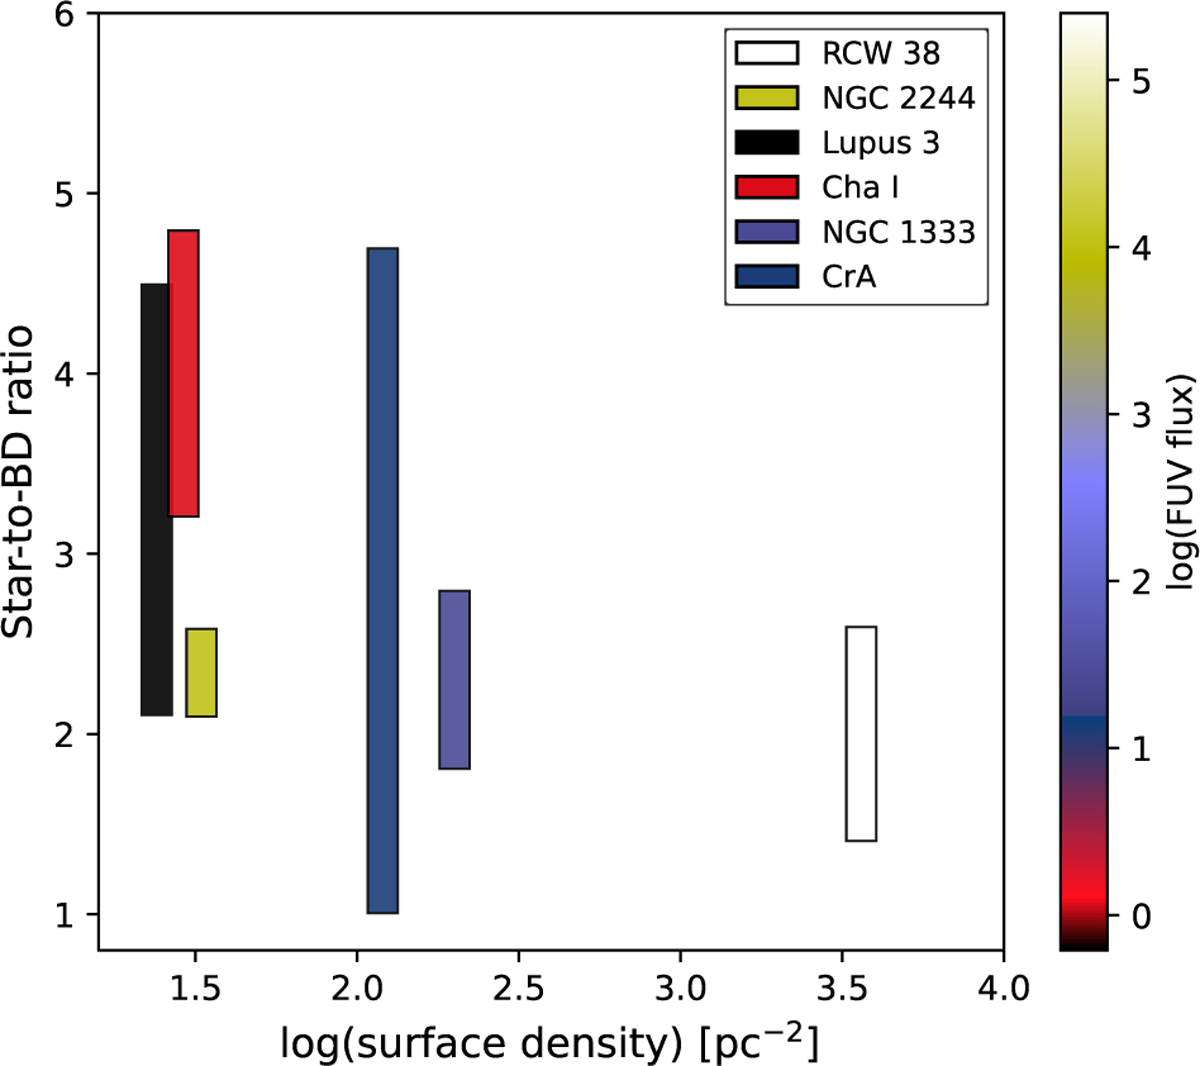
Star-to-BD ratio in various SFRs as a function of stellar surface density. Each rectangle represents a different cluster, and the height corresponds to the range of star-to-BD ratios; the width was chosen arbitrarily. The color of each rectangle indicates the median FUV flux in the region.
Current usage metrics show cumulative count of Article Views (full-text article views including HTML views, PDF and ePub downloads, according to the available data) and Abstracts Views on Vision4Press platform.
Data correspond to usage on the plateform after 2015. The current usage metrics is available 48-96 hours after online publication and is updated daily on week days.
Initial download of the metrics may take a while.