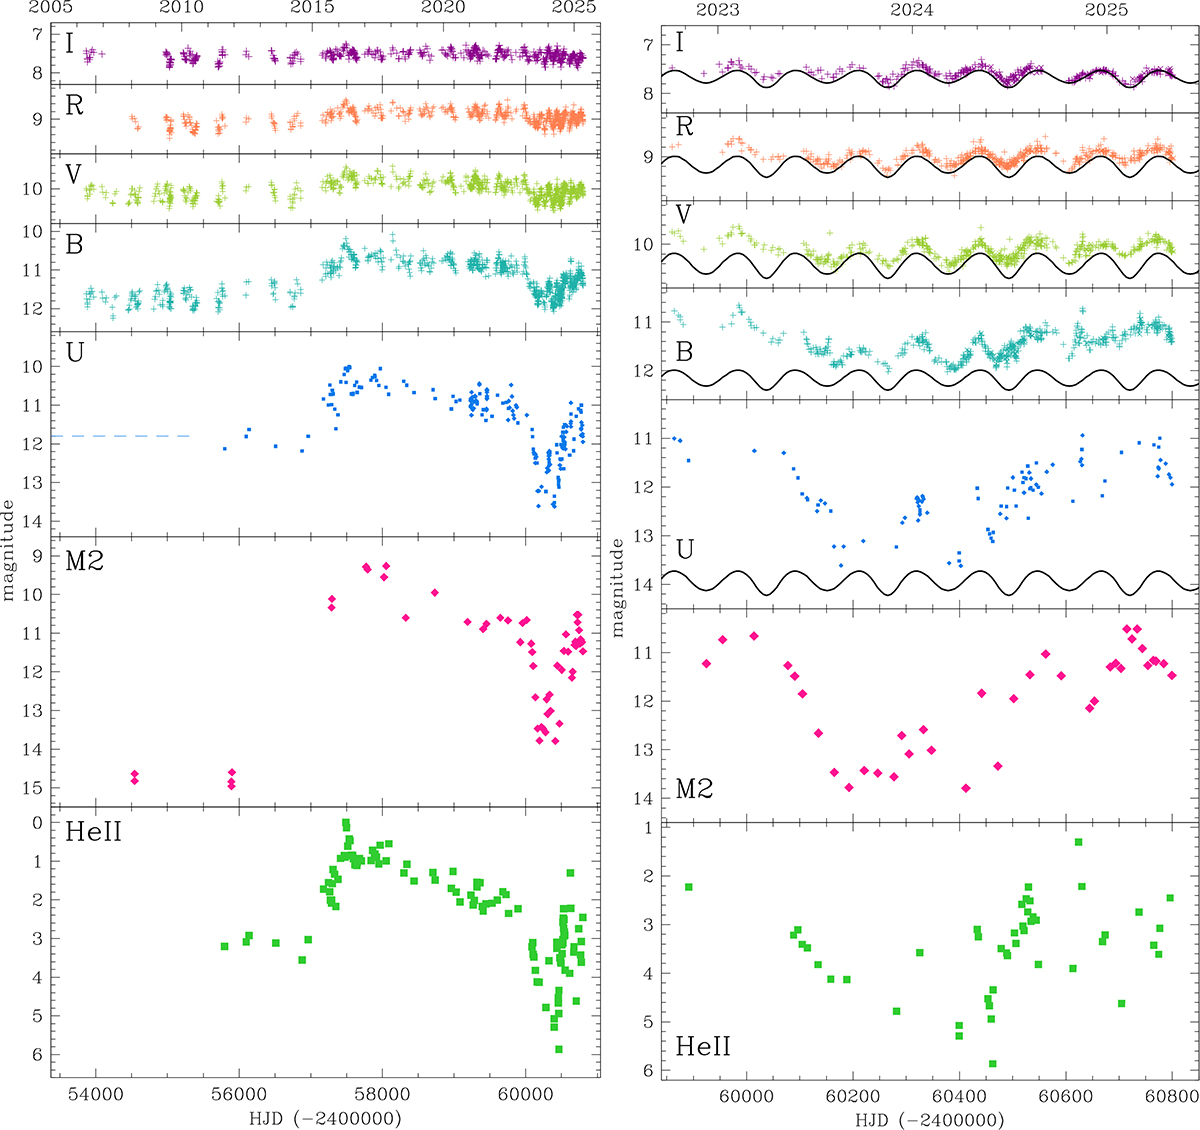
Fig. 1.
Download original image
Photometric evolution of T CrB over the last 20 years, with the panels at right zooming on the last four orbital revolutions. The UBVRI data are from the ANS Collaboration monitoring program, M2 is the UVOT band from the Swift satellite, and the flux of the HeII 4686 emission line is expressed in magnitudes relative to the peak value (Fmax = 4.42 × 10⁻¹² erg cm−2 s−1; see Sect. 4 for details). The continuous curves at right is the light curve in that band of the bare, ellipsoidal distorted red giant without contribution from the stream, the hot spot, and the accretion disk (see the radiative modeling in Sect. 7 for details).
Current usage metrics show cumulative count of Article Views (full-text article views including HTML views, PDF and ePub downloads, according to the available data) and Abstracts Views on Vision4Press platform.
Data correspond to usage on the plateform after 2015. The current usage metrics is available 48-96 hours after online publication and is updated daily on week days.
Initial download of the metrics may take a while.