| Issue |
A&A
Volume 701, September 2025
|
|
|---|---|---|
| Article Number | A176 | |
| Number of page(s) | 19 | |
| Section | Stellar structure and evolution | |
| DOI | https://doi.org/10.1051/0004-6361/202555917 | |
| Published online | 11 September 2025 | |
T CrB: Overview of the accretion history, Roche-lobe filling, orbital solution, and radiative modeling
1
INAF National Institute of Astrophysics, Astronomical Observatory of Padova, 36012 Asiago (VI), Italy
2
Department of Physics and Astronomy, Stony Brook University, Stony Brook, NY 11794-3800, USA
3
INAF Osservatorio di Astrofisica e Scienza dello Spazio, via Gobetti 101, 40129 Bologna, Italy
4
Departamento de Ciencias Físicas, Universidad Andrés Bello, Fernández Concha 700, Las Condes, Santiago, Chile
5
ANS Collaboration, c/o Astronomical Observatory, 36012 Asiago (VI), Italy
6
Department of Physics and Astronomy, University of Padova, Asiago Astrophysical Observatory, 36012 Asiago (VI), Italy
⋆ Corresponding author: This email address is being protected from spambots. You need JavaScript enabled to view it.
Received:
12
June
2025
Accepted:
25
July
2025
Abstract
Context. Expectations for an imminent new outburst of the recurrent symbiotic nova T CrB are mounting, initiated by the discovery in 2015 of a new enhanced mass-transfer phase (SAP), which is reminiscent of the one preceding the last recorded outburst in 1946.
Aims. We aim to derive a robust estimate of the most important parameters describing the physical nature of T CrB, trace the accretion history onto its white dwarf, and account for the unexpected delay in the occurrence of the new outburst. In particular, the SAP prior to 1946 was brighter and followed by a nova eruption within six months from its conclusion. This time the 2015–2023 SAP has been fainter and although two years have passed since the end of this phase, no new eruption has taken place.
Methods. Between 2005–2025, the period covering the SAP and the preceding quiescence, we collected a massive amount of photometric and spectroscopic observations at optical wavelengths. We analyzed these data together with the abundant ultraviolet (UV) observations available in the archive of the Swift satellite.
Results. Guided by the results of the orbital solution and, in particular, by the radiative modeling process we employed on the whole set of available data, we derived for T CrB a binary period of 227.5528 days, along with an inclination of 61° and masses of 1.35 M⊙ and 0.93 M⊙ for the white dwarf and the M3III companions, respectively, making the mass transfer dynamically stable. The red giant completely fills its Roche lobe and at Vrot sin i = 4.75 ± 0.26 km s−1, it is rotating much more slowly than the 16 km s−1 co-rotation value. The ∼20° azimuth of the hot spot, implied by the hump shaping the optical light curve in quiescence, fixes the outer radius of the disk to ∼58 R⊙. This is the same as the canonical value expected from disk theory. In quiescence, the disk is cold and mostly neutral. The SAP was caused by an inside-out collapse of the disk, during which the mean accretion rate onto the WD was ∼28× larger than in quiescence. The SAP ended in late April 2023, but from May 2024, the mass flow has intensively resumed at disk inner radii, while the collapse wave reached the outer portions of the disk. The consequent revamp in the mass accretion could fill the gap inherited by the fainter 2015–2023 SAP and eventually lead the WD accreted shell to ignition.
Key words: accretion / accretion disks / binaries: symbiotic / novae / cataclysmic variables
© The Authors 2025
 Open Access article, published by EDP Sciences, under the terms of the Creative Commons Attribution License (https://creativecommons.org/licenses/by/4.0), which permits unrestricted use, distribution, and reproduction in any medium, provided the original work is properly cited.
This article is published in open access under the Subscribe to Open model. This email address is being protected from spambots. You need JavaScript enabled to view it. to support open access publication.
1. Introduction
T CrB is a famous symbiotic nova, which is an otherwise normal nova (powered by explosive thermonuclear burning) that erupts within a symbiotic binary (see Munari 2025, for a recent review on symbiotic novae). Its outbursts were observed in 1866 and 1946 (see the detailed summary by Kenyon 1986, and references therein), along with previous events that had possibly been recorded in ancient times (Schaefer 2023b).
After the return to quiescence following the 1946 outburst, T CrB has spent a quiet life accreting onto the white dwarf (WD) at (very) low rates, with just some weak emission in Hα generally visible in the optical spectra, which are otherwise dominated by the absorption spectrum of the M3III red giant (RG) companion. On rare occasions (Iijima 1990; Anupama & Prabhu 1991; Hric et al. 1998), a temporary surge in accretion has powered stronger emission in the lines and the Balmer continuum. As described by Munari et al. (2016), in 2015 T CrB drastically changed its status when it entered a phase of enhanced mass transfer – reminiscent of a similar event lasting about eight years that preceded the 1946 outburst (Payne-Gaposchkin & Wright 1946). For reasons of continuity with earlier studies of T CrB, we continue using “SAP” to refer to this phase of enhanced mass transfer onto the WD preceding an outburst, even if its original meaning of “super-active accretion phase” has since evolved. The appearance of the SAP led Munari et al. (2016) to consider a new outburst of T CrB as probable for 2025-2026, a view that has been shared by many others since (e.g., Luna et al. 2020; Zamanov et al. 2023; Schaefer 2023a; Maslennikova et al. 2023). This brought on the advantage of spurring intense pre-eruption monitoring of T CrB and the submission of ready-to-be-triggered proposals to most of the ground and space observing facilities. This level of alertness from the community, along with the expected V ∼ 1.5/2.0 mag peak brightness (Kukarkin 1946; Shears 2024) and the proximity of T CrB to Earth (0.92 kpc according to Gaia DR3 parallax; Gaia Collaboration 2016, 2023), will likely result in a wealth of multiwavelength information essential to improving our understanding and modeling of such phenoma. This possibility comprises a significant leap forward in our progressive understanding of novae in general and their symbiotic subclass in particular.
The SAP phase of T CrB ended in 2023 (Munari 2023b), lasting for about eight years, just as the one that preceded the 1946 eruption. In this paper, on the basis of a massive and multiwavelength observational effort we carried out on T CrB, we review (i) the global properties of the 2015-2023 SAP in comparison with the long-term preceding quiescence; (ii) the amount of mass-flow through the disk to be subsequently accreted by the WD; (iii) the reformation of a steady disk following its collapse during SAP; (iv) the orbital solution, mass function, and constraints on the orbital inclination; and (v) the structure, extent, and evolution of the disk during quiescence and SAP derived by radiative modeling.
2. Observations
We note that the closing date for the inclusion of new observations in the present paper is May 3, 2025. We present the observational data used in our study in the following subsections.
2.1. UBVRI photometry
BVRI photometry for T CrB has been continuously obtained since 2005 with various ANS Collaboration telescopes. The Asiago Schmidt 67/92cm telescope, which has an optical train completely transparent to near ultraviolet (NUV) wavelengths down to the atmospheric cut-off, has been used primarily for U-band observations. All telescopes observed T CrB in all bands at each visit. All the photometry has been transformed from the local instantaneous photometric system to the Landolt (1992, 2009) standard system via color equations solved for all frames of each night via the UBVRI reference sequence located around T CrB and calibrated by Henden & Munari (2006). The same reference photometric sequence and the same observing and reduction procedures (Munari et al. 2012; Munari & Moretti 2012) have been similarly adopted at all telescopes over all nights, ensuring a high degree of homogeneity over the entire 2005–2025 photometric dataset. The collected photometric data are listed in Table 1, where the quoted uncertainties are the total error budget (TEB), which quadratically combine the Poisson error and the error associated with the transformation to the standard system via the color equations (usually the dominating term). Median values for TEB are 0.009 for V, 0.012 for (B − V), 0.013 for (V − R), 0.012 for (V − I), and 0.012 for (U − B). The total number of UBVRI runs is 712, which are distributed over 581 different nights. The corresponding light curves are plotted in Fig. 1, where the large scatter of plotted data is not due to errors, but is instead a manifestation of the orbital modulation and the large flickering persistently affecting T CrB.
Our UBVRI photometry of T CrB. The second columns provides the HJD−2400000.
The number of points in the U-band light curve of Fig. 1 was increased by adding the results of integrating the U magnitude on the low resolution Asiago 1.22m + B&C spectra (see Sect. 2.2 below), which are characterized by a high signal-to-noise ratio (S/N), a blue wavelength limit around 3200 Å, and excellent fluxing. The band transmission profiles of Landolt (1992) have been adopted, with the flux zero-points taken from Bessell et al. (1998). Before computing the U magnitude, the flux zero-point of the spectra needed to be scaled so that the computed B magnitude would equal that of conventional photometry from Table 1. To estimate the uncertainty of such a procedure in deriving the U band magnitude, we observed over different nights and with the same instrumentation and data handling procedures about a dozen standard stars of a red color similar to T CrB (B − V ≥ 0.7), selected from Landolt (2009). The U magnitude so computed from the spectrum did match the tabulated one within 0.1 mag, which is fully adequate for the aims of the present paper.
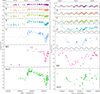 |
Fig. 1. Photometric evolution of T CrB over the last 20 years, with the panels at right zooming on the last four orbital revolutions. The UBVRI data are from the ANS Collaboration monitoring program, M2 is the UVOT band from the Swift satellite, and the flux of the HeII 4686 emission line is expressed in magnitudes relative to the peak value (Fmax = 4.42 × 10⁻¹² erg cm−2 s−1; see Sect. 4 for details). The continuous curves at right is the light curve in that band of the bare, ellipsoidal distorted red giant without contribution from the stream, the hot spot, and the accretion disk (see the radiative modeling in Sect. 7 for details). |
2.2. Spectroscopy
A similarly large effort was conducted in recording spectra of T CrB over 2011–2025 with telescopes located in Asiago, CTIO and Varese. The spectroscopic data presented in this paper will be made public available via CDS.
Low-resolution spectroscopy of T CrB was obtained over 2011–2025 with the Asiago 1.22m + B&C telescope, which has an optical train completely transparent to NUV wavelengths down to the atmospheric cut-off. The detector is an Andor iDus DU440 CCD camera (2048 × 512 pixels, 13.5 × 13.5 μm each), which is characterized by a high near-UV sensitivity. A 300 ln/mm grating blazed to 5000 Å allowed us to cover the 3200–8000 Å range at 2.31 Å/pix dispersion. The slit was set to a width of 2 arcsec and has always been rotated to the parallactic angle for optimal flux calibration against the spectrophotometric standards observed each night. The slit height of ∼8 arcmin allowed for the careful sampling and subtraction of the sky background.
The high-resolution spectra of T CrB were recorded with the Asiago 1.82m telescope + REOSC Echelle spectrograph. The 3550–7100 Å interval is covered in 32 orders without inter-order gaps by an Andor DW436-BV camera (housing an E2V CCD42-40 AIMO CCD, with 2048 × 2048 array, and 13.5 μm pixel size). The resolving power is 20 000 for the standard 2-arcsec slit width. The slit height of 22 arcsec allows recording free 8 arcsec on both sides of the stellar spectrum for a careful definition of the sky background to subtract.
Echelle spectra of T CrB were also obtained with the Varese 0.84 m telescope, equipped with a long-slit mark.III Multi-Mode Spectrograph from Astrolight Instruments. The camera is a SBIG ST10XME CCD and the 4250–8850 Å range is covered in 32 orders without inter-order gaps. A 1 × 1 binning and the 2.0 arcsec slit width provide a resolving power ∼17 000.
We also observed T CrB from CTIO in Chile, where it transits low over the northern horizon, using the CHIRON (Tokovinin et al. 2013) fiber-fed bench-mounted Echelle spectrograph mounted on the 1.5 m telescope operated by SMARTS. We used CHIRON in “fiber” mode with 4 × 4 on-chip binning yielding a resolution λ/Δλ ∼ 27 800. Typical Chiron exposure times were 10 minutes each.
All spectra acquired with the Asiago and Varese telescopes have been reduced in IRAF, with all standard steps involving correction for bias, dark and flat frames, sky subtraction, wavelength, and flux calibration. The Chiron spectra were similarly reduced using software written in IDL1. We note that since Chiron is fed by a single 2.5 arcsec diameter fiber, simultaneous sky subtraction is not possible. Under clear sky conditions, for a target as bright as T CrB, this is an issue only in the vicinity of bright night sky lines, such as the Na D lines and [O I] 6300. Flux calibration is performed order-by-order using spectra of μ Col to establish the instrumental response and orders are stitched together. There are five inter-order gaps longword of 8260 Å. The correction to absolute fluxes depends on sky conditions and it is accomplished by comparison with contemporaneous optical photometry.
2.3. Swift satellite UV observations
To complement our optical ground-based observations with UV data, we selected a series of pointing performed over nearly two decades, between 2008 and 2025, with the UltraViolet Optical Telescope (UVOT; Roming et al. 2005) on board the Neil Gehrels Swift satellite (Gehrels et al. 2004). These observations were downloaded from the ASI-SSDC archive2 and were chosen to be as close to simultaneous as possible to specific optical spectrophotometric epochs we collected during this time range. UV observations were acquired in the UVW1, UVM2, and UVW2 filters, with reference wavelengths 2600, 2246 and 1928 Å, respectively (see Poole et al. 2008; Breeveld et al. 2011, for details).
All data were reduced within the FTOOLS environment (Blackburn 1995). Count rates on Level 2 (i.e., calibrated and containing astrometric information) UVOT images of T Crb were measured through aperture photometry within a 5″ radius centered on the source position, whereas the corresponding background was evaluated for each image using several circular regions in source-free nearby areas. The UV magnitudes were then determined using the UVOTSOURCE task and were calibrated using the UVOT photometric system described by Poole et al. (2008); the most recent fixings (2020 November) recommended by the UVOT team were taken into account and a check to reject small scale sensitivities3 was also performed. Furthermore, with respect to the UV images where the object was shown to be saturated, we applied the criterion of Page et al. (2013) to determine the corresponding magnitudes from the readout streaks produced by the source. A summary of the UV observations used in this paper, together with the corresponding results, is presented in Appendix A.
3. Reddening
The high +48° Galactic latitude implies a low reddening affecting T CrB, supported by published values such as EB − V = 0.15 by Cassatella et al. (1982) and EB − V = 0.07 by Nikolov (2022) or, alternatively, the EB − V = 0.056 upper limit by Schlafly & Finkbeiner (2011).
In this work, we applied an independent method to derive the interstellar reddening. All our Chiron Echelle spectra of T CrB were recorded in fiber mode at a resolving power of ∼27 800, except one. The spectrum for 2022-08-16 was recorded in slicer mode, boosting the resolving power to ∼78 000. Such a high value and the large barycentric velocity of T CrB allows to disentangle the NaI line profile into the stellar and interstellar components. This is illustrated in Fig. 2, where the profile is fitted with a combination of three narrow Gaussians (the other NaI line at 5896 Å shows an identical profile).
 |
Fig. 2. Part of the Chiron spectrum of T CrB for 2022-08-16, recorded in slicer mode for a resolving power of ∼78 000. The NaI line at 5890 Å is de-convolved into the stellar component (at −28.5 km s−1 heliocentric velocity) and additional two of interstellar origin (at −22.0 and −15.0 km s−1), with an indication of the corresponding interstellar reddening. |
The bluest of the three fitting Gaussian traces the stellar component at a measured heliocentric velocity of −28.5 km s−1 that offers a good match to the velocity of the red giant from the orbital solution derived below (Sect. 6). The other two components are of interstellar origin and are characterized by heliocentric velocities of −22.0 and −15.0 km s−1, with equivalent widths of 0.1848 and 0.0551 Å, respectively. Adopting the calibration of Munari & Zwitter (1997), these equivalent widths translate to 0.060 and 0.015 reddening values, for a total EB − V = 0.075 interstellar extinction affecting T CrB. This is the value we adopted in this study, which happens to sit in the middle of the range of reddenings reported in the literature. At such a low reddening, no other interstellar feature (atomic KI or diffuse interstellar bands) is strong enough for a fruitful measurement – or even detection.
4. The long-term evolution of T CrB
The photometric evolution of T CrB over the last twenty years is plotted in Fig. 1. The dashed horizontal line in the U band panel marks the median quiescence brightness of T CrB as derived from published observations (e.g., Raikova & Antov 1986; Munari et al. 1992; Zamanov & Zamanova 1997; Hric et al. 1998; Zamanov et al. 2004; Henden & Munari 2008). The panels at right of Fig. 1 offer an expanded view onto approximately the last four orbits of T CrB, covering the post-SAP phase. The continuous curves in each panel show the light curve as we would expect to observe it from the sole ellipsoidal distorted red giant. These curves have been computed as part of the radiative modeling we performed (described in Sect. 7) to provide a term of comparison against which we can evaluate the contribution of all other components combined (WD, accretion disk, ionized RG wind, etc.).
To highlight the strict parallelism between accretion-driven photometric brightness and spectral appearance, we present the flux evolution of the HeII 4686 emission line as measured on our Asiago 1.22m + B&C + 300 ln/mm grating spectra (bottom panel of Fig. 1). For a direct comparison with the photometric magnitudes, the flux of the HeII 4686 emission line is also expressed as magnitudes (−2.5 × log[Flux/Fmax]) in Fig. 1, relative to the peak value Fmax = 4.42 × 10⁻¹² erg cm−2 s−1, which was reached for our spectrum of 2016-04-03. The flux of HeII 4686 emission line was measured on our Asiago spectra after the subtraction of a template M3III spectrum (HD 112300) obtained with the same instrumentation and set-up (as illustrated in Fig. 3), a procedure necessary to provide cleaner and unbiased results and which allows for the detection of HeII at its faintest levels.
 |
Fig. 3. Detection of the presence of weak emission lines in the spectra of T CrB based on subtracting the scaled spectrum of an M3III template. Top panel: Portion of Asiago 1.22m + B&C + 300 ln/mm spectra of T CrB and the M3III template HD 112300. Lower panel: Subtracted spectrum revealing the presence of emission lines other than Hβ. The ordinates are given in 10−13 erg cm−2 s−1 Å−1 in both panels. |
Four distinct phases have been identified in the photometric and spectroscopic evolution of T CrB shown in Fig. 1, with corresponding representative spectra presented in Fig. 4. These phases are as follows:
 |
Fig. 4. Spectra of T CrB collected with the Asiago 1.22m telescope selected for being representative of the evolutionary phases T CrB has gone through during the last 20 years, as discussed in Sect. 4. |
-
(1) The tail, extending to May 2014, of the long quiescence following the last outburst in 1946, with the spectrum for 2012-09-03 being representative of typical appearance during this protracted quiescence;
-
(2) The enhanced mass-transfer phase (SAP), starting in the second half of 2014, peaking in brightness in May 2016 (cf. the spectrum for 2016-05-26) and smoothly declining (cf. the 2021-05-25 spectrum) through early 2023;
-
(3) A post-SAP deep minimum, with U-band brightness and flux in high-ionization emission lines dropping well below quiescence levels (cf. the 2023-12-03 spectrum);
-
(4) A recovery in the accretion flow through the disk and therefore in brightness (cf. the spectrum for 2025-05-01), bringing T CrB back to or even above the photometric levels of quiescence.
4.1. Phase 1: Quiescence prior to the SAP
The period of quiescence of T CrB following the 1946 outburst and up to the start of the SAP was already discussed among others by Munari et al. (2016) and is not re-investigated here. The light curve during this phase is dominated by the visibility of the hot spot and the ellipsoidal distortion of the red giant, which fills its Roche-lobe, inducing an orbital modulation of increasing amplitude with decreasing wavelength, reaching ∼0.5 mag in the V band (see the results of radiative modeling in Sect. 7 below). The faint status of the disk around the WD during quiescence allows for a clean detection of the incessant flickering associated with the accretion process (cf. Sokoloski et al. 2001; Zamanov et al. 2004; Dobrotka et al. 2010, among many others). The spectrum for 2012-09-03 (seen in the upper panel of Fig. 4) is typical of the quiescence period: at a first look it is that of a normal M3III red giant, the interacting-binary nature betrayed only by limited emission in Hα and a weak flux excess at the shortest wavelengths caused by the blue continuum originating from the disk and the hot spot. At a more careful evaluation, the quiescence spectra reveals the presence of other and much weaker emission lines (higher Balmer terms, HeI, HeII); however, to access them, it is necessary to subtract the spectrum of a M3III template, as illustrated in Fig. 3.
It is interesting to note that the 2005-2013 quiescence part of the B-band light curve of T CrB in Fig. 1 shows a rather slow, but nonetheless distinct rise in brightness, at a rate ΔB = −0.040 mag yr−1, which is probably indicative of an equivalent slow rise in the accretion flow through the disk. Similarly slow and low-amplitude rising and declining trends have been a constant for T CrB in quiescence (e.g., Stanishev et al. 2004).
4.2. Phase 2: Enhanced mass-transfer phase (SAP)
As first noticed by Munari et al. (2016), T CrB left quiescence around May 2014 and began a steady increase in brightness as a consequence of a marked and unprecedented increase in the mass flow through the disk and toward the WD. This is known as an enhanced mass-transfer phase (SAP), stressing its uniqueness in the behavior that T CrB displayed since the 1946 eruption.
The maximum brightness during the SAP was reached by T CrB in April-May 2016, after a smooth rise lasting two years during which the binary had time to completed three full orbital revolutions. In comparison with the quiescence levels in Fig. 1, at the SAP peak the brightness of T CrB increased by ΔU = 3.4 (13.2↔9.8), ΔB = 1.2 (11.5↔10.3), ΔV = 0.5 mag (10.1↔9.6), and progressively less for R and I bands; the rise in flux of HeII was similar to that of U-band, amounting to ΔHeII = 3.0 mag. Soon after reaching the SAP maximum, T CrB begun a slow and steady descent, at mean rates ΔHeII = 0.27, ΔU = 0.15, and ΔB = 0.05 mag yr−1. The SAP phase sharply terminated in early May 2023 (cf. U-band panel at right in Fig. 1), when T CrB was still ΔU ∼ 0.5 mag brighter than average quiescence. Overall, T CrB spent two years reaching the SAP maximum and seven years declining from it.
The spectrum of T CrB at the SAP maximum is well represented by the observation for 2016-05-26 in Fig. 4. Compared to quiescence (the 2012-09-03 spectrum in the same Fig. 4), a huge increase in the continuum flux at blue wavelengths is obvious; as outstanding is the intensity of emission in the Balmer continuum. The absolute flux radiated by emission lines increased by ∼15× compared to quiescence, with HeII 4686 turning into the third strongest line after Hα and Hβ, and HeI and Bowen fluorescence at 4640 Å being rather strong too. The difference spectrum (i.e., the SAP spectrum minus that in quiescence) closely resembles the typical spectrum of a CV in quiescence, which is dominated by the emission from the accretion disk (to this end, compare the difference spectrum in Figure 4 of Munari et al. (2016) with the mean CV spectrum of Figure 1 in Zwitter & Munari (1995) obtained at the same resolving power.
The rise in the SAP maximum is characterized by a gradual strengthening of the emission from the accretion disk (the blue and Balmer continua, the emission lines), and an increase in the ionization conditions as traced by the HeII/Hβ and HeII/HeI line ratios. The decline from the SAP maximum traced back along the same evolutionary pattern followed during the rise; for example, the spectrum for 2021-05-25 (see Fig. 4) taken halfway through the descent from the SAP maximum, is indistinguishable from the spectrum for 2015-10-16 from Munari et al. (2016, their Fig. 4) obtained halfway through the rise to the SAP maximum.
The emission line profiles convey information about the amount of radiating mass and the kinematical location of the emitting regions and of those in foreground causing any superimposed absorption components. With the Asiago 1.82 + Echelle and CTIO 1.5m + Chiron telescopes, we densely monitored T CrB during the SAP phase. In Appendix B, we present an atlas of the evolution of the emission line profiles for a sample of lines; namely, Hα, Hβ, HeII 4686, HeI 5876 (triplet), HeI 6678 (singlet), and [OIII] 5007. We show the profiles for selected 98 epochs (the same epochs for all lines), distributed between April 2015 and June 2023 and covering the entire SAP phase. A detailed analysis and quantitative modeling of such profiles, with all their fine details and multi-components, responsive to both the accretion flow and to the orbital phase, is well beyond the scope of the present paper. These aspects will be tackled in a future study.
4.3. Phase 3: Post-SAP deep minimum
As illustrated by the U and M2 panels in Fig. 1, the SAP phase ended rather sharply in late April 2023, when T CrB entered a steep decline that in four months, by late August, brought the star close to the U-band brightness of the bare M3III giant, notably well below the median U-band brightness characterizing the long quiescence since the last outburst of 1946. At the time of the late August 2023 minimum, HeII also dropped below quiescence levels, while M2 went down by 3 mag compared to the SAP maximum, but remained ∼1 mag brighter than in quiescence.
After the rebound in brightness around mid-January 2024, a second drop in late March 2024 took T CrB again close to the U-band brightness of the bare M3III. The two minima (August 2023 and March 2024) were identical in the BVRI bands and in the Swift satellite M2 UV measurements; however, they strongly differed in the behavior of HeII, which dropped almost two magnitudes fainter during the second minimum compared to the first one.
The spectrum for 2023-12-03 in Fig. 4 aptly represents the average conditions for T CrB during the protracted deep minimum phase following the end of the SAP. Compared with the typical quiescence spectrum for 2012-09-03 in the same figure, the emission in Hα is clearly reduced, as is the veiling from the blue continuum from the disk; for comparison, we can look to the depth of blue TiO bands and the visibility of CaI 4227 and CaII H&K at 3933 and 3967 Å.
4.4. Phase 4: Recovery from the deep minimum
Following the passage at the second deep minimum in March 2024, T CrB was on a rise in brightness with superimposed a lot of chaotic, short-term, and large-amplitude variability, which is particularly evident in the U and HeII light curves of Fig. 1. Here, we can observe photometric changes up to 1 magnitude occurring on a matter of a few days, correlated with a revamp or retreat in the intensity of the blue veiling continuum and the emission lines.
The apparently brightest of such short-living episodes happened on 2024-11-16 when T CrB peaked at B = 10.72 and U = 10.94 mag, as confirmed by independent observations from three different ANS Collaboration telescopes (the same three telescopes that recorded T CrB fainter by 0.6 mag in B and U both two days before and two days later). The same flare is well visible also in the intensity of HeII 4686 (and to a lesser extent in HeI and Balmer lines too), with the noteworthy feature that in HeII (and marginally in HeI too) the flare peaks a week earlier than in U and B band photometry. Our Echelle spectra obtained with the Varese 0.84m telescopes provide the integrated HeII 4686 emission line fluxes for November 2024 listed in Table 2. Combined with the HeII fluxes from low-res spectra quoted in Teyssier et al. (2024), the peak HeII flux was reached on November 9, with e-folding times of ≤1 day for the rise and ∼7 days for the decline.
Integrated HeII 4686 emission line fluxes (in units of 10−13 erg cm−2 s−1) for the flare T CrB underwent in November 2024.
The rise in brightness following the second deep minimum brought T CrB well above the mean quiescence and close to the level characterizing the latest stages of the SAP. Then it was seen to distinctively level off during the last few months prior to the submission of this paper (see also Merc et al. 2025). The spectrum for 2025-05-01 in Fig. 4 may be considered representative of average conditions during this leveling off. Compared with the typical quiescence spectrum for 2012-09-03 in the same figure, T CrB is currently more active, with much stronger emission in Balmer, HeI, and HeII lines, along with a Balmer continuum that is clearly seen in emission above the reinforced blue continuum veiling the spectrum of the red giant at the shortest wavelengths. After the deep minima of August 2023 and March 2024, the mass flow through the inner radii of the accretion disk is back at the levels of the latest stages of the SAP and well above that typical for the long quiescence phase following the 1946 nova eruption.
4.5. Comparing the SAP in 1936–1945 and 2015–2023
Just prior to the 1946 eruption, T CrB underwent a SAP phase similar to that experienced in 2015–2023. This led Munari et al. (2016) to be the first to speculate about an approaching new eruption, a view later shared by many others in the community (e.g., Luna et al. 2020; Zamanov et al. 2023; Schaefer 2023b). Ultimately, it resulted in an intensified pre-eruption monitoring of T CrB and the submission of ready-to-be-triggered proposals to most of the ground and space observing facilities.
The recent and historic SAP phases (1936–1945 and 2015–2023) are compared in Fig. 5. The DASCH digitization of Harvard historical photographic plates (Grindlay et al. 2012) have been accessed to retrieve the historical data. The two SAP phases look rather similar, especially in the overall duration, as well as in the rise- and the decline-rates. As discussed below, the SAP event probably corresponds to the accretion disk flushing toward the WD most of the mass accumulated during the inter-outburst long interval. The close similarity of the 1936–1945 and 2015–2023 events suggests that the occurrence of an SAP is triggered by the disk reaching an upper limit to its stable configuration after decades of steady mass transfer from the Roche-lobe filling RG companion. However, there are a couple of discrepancies seen among the two SAP phases:
 |
Fig. 5. Comparison between the SAP phase that T CrB underwent prior to the 1946 outburst and the 2015–2023 recent one. |
-
The 1946 nova eruption took place about six months after the SAP was concluded, while the recent SAP ended more than two years ago and T CrB has not yet undergone a new outburst;
-
The overall radiated brightness was larger (by about 40%) for the SAP preceding the 1946 nova eruption than for the current one.
The radiated brightness relates to the amount of mass flowing through the disk, so it is tempting to deduce from the above two points that there has not yet been any new outburst following the end of the 2015–2023 SAP phase because (contrary to 1936–1945) not enough mass has been transferred thus far from the disk to the WD to reach ignition conditions for a thermonuclear runaway. Nonetheless, over the last year, T CrB has experienced a recovery to higher than quiescence rates in the flow through the disk, which could make up for the deficit in the mass accumulated on the WD surface and eventually lead to the much anticipated new eruption.
5. Radiated luminosity and mass accreted by the WD
Combining the Swift observations in the W2, M2, and W1 UV bands with the Asiago 1.22m + B&C spectra (or UBVRI photometry for the epochs when Asiago spectra are not available), it is possible to reconstruct the spectral energy distribution (SED) of T CrB fairly well over the 1700–8000 Å range. This is illustrated in Fig. 6, where the SED at four sample epochs is compared to that of the template M3III star HD 112300, constructed from IUE and Asiago spectra, dereddened and flux-scaled to the Gaia DR3 distance of T CrB. By subtracting the SED of the scaled M3III template to that of any epoch in which a Swift observation is available at least in the M2 band, we obtained the corresponding SED associated to the accretion process. Its integration returns the accretion luminosity radiated over the 1700–8000 Å range; for illustrative purposes and for a few sample epochs, Fig. 6 represents the computation of such a luminosity separately for the optical (3500–8000 Å) and the UV (1700–3500 Å) segments to highlight the dominance of the latter.
 |
Fig. 6. Examples of the spectral energy distribution of T CrB from quiescence (2008-2011) to SAP peak (2016), and for reference that of the M3III template HD 112300, plotted in black and scaled to the distance of T CrB. Quoted LUV and Lopt are the accretion luminosities (in L⊙) radiated over the 1700–3500 and 3500–8000 Å intervals, respectively. Note on the SED for 2008–2011 the effect of the red-leak affecting the Swift W2 filter. |
The Swift W2 filter is known to be affected by red-leak, which comes into play when very red objects are observed. In quiescence, the disk of T CrB is faint and most of the flux recorded through the W2 filter (where nominal UV transmission starts at 1600 and peaks at 1900 Å) comes from the RG through the red leak, making the observations in this filter useless (cf. SED for 2008–2011 in Fig. 6). However, when the disk brightens and the UV flux increases, as seen during the SAP, the effect of the red-leak becomes irrelevant and the W2 measurements can be safely incorporated into building the SED (cf. the SED for 2021-07-10 in Fig. 6).
The SAP and its subsequent phases have been fairly well covered by Swift and near-simultaneous optical observations, so that the evolution of the accretion luminosity can be accurately followed; this comes with the caveat, however, that Swift did not observe T CrB during the broad peak of 2016. Still, the events of 2016 have been densely covered by spectroscopic observations and the integrated flux of the HeII 4686 emission line can be used to estimate the corresponding flux at M2 wavelengths. To this aim, we compared the integrated flux of the HeII 4686 line and the flux at M2 effective wavelength for the many SAP epochs where the two values have been measured within a two-day delay to minimize the disturbance by the short term variability characterizing T CrB. We found a good proportionality of the two reddening-corrected values taking the form
![Mathematical equation: $$ \begin{aligned} \log (\mathrm{flux [M2]}) = 0.927\times \lg (\mathrm{flux [HeII]}) - 1.515 .\end{aligned} $$](/articles/aa/full_html/2025/09/aa55917-25/aa55917-25-eq1.gif) (1)
(1)
In the process, we found that the integrated flux of the HeII 4686 emission line is also strongly correlated with the U-band brightness in the form corrected for reddening, namely,
![Mathematical equation: $$ \begin{aligned} \log (\mathrm{flux [HeII]}) = - 0.5025\times U - 6.229 .\end{aligned} $$](/articles/aa/full_html/2025/09/aa55917-25/aa55917-25-eq2.gif) (2)
(2)
In both relations, the flux is expressed in erg cm−2 s−1. Then, Eq. (1) allows us to reconstruct the SED during the broad SAP peak of 2016 by using the many measurements available for HeII.
By integrating the SEDs over 2015–2025, we found that during the SAP, the total accretion luminosity radiated by T CrB over the interval 1700–8000 Å was
![Mathematical equation: $$ \begin{aligned} L_{\rm acc}^\mathrm{SAP}\mathrm{[UV-opt]} = 6.7\times 10^{43}\,\mathrm{erg} ,\end{aligned} $$](/articles/aa/full_html/2025/09/aa55917-25/aa55917-25-eq3.gif) (3)
(3)
with
![Mathematical equation: $$ \begin{aligned} M_{\rm acc}^\mathrm{SAP}\mathrm{[UV-opt]} = 2.6\times 10^{-7}\,\mathrm{M}_\odot ,\end{aligned} $$](/articles/aa/full_html/2025/09/aa55917-25/aa55917-25-eq4.gif) (4)
(4)
as the corresponding mass accreted by the WD of 1.35 M⊙; such a total can be split into yearly percentages of 9.4, 19.5, 18.4, 15.0, 12.4, 7.7, 6.3, 5.5, 2.5, 1.9, and 2.8 going from 2015 to 2025.
The quiescence phase following the 1946 eruption has not been mapped equally well as SAP. For sake of discussion and considering the self-similar spectroscopic appearance that T CrB maintained during the whole quiescence, we can suppose that the accretion luminosity Lacc ∼ 2 L⊙ (derived in Fig. 6 as the mean value for 2008–2011) also applies to the rest of the quiescence; under such circumstances, the total accretion luminosity radiated over the interval 1700–8000 Å during 1947–2014 then becomes
![Mathematical equation: $$ \begin{aligned} L_{\rm acc}^\mathrm{quiesc}\mathrm{[UV-opt]} = 1.6\times 10^{43}\,\mathrm{erg} ,\end{aligned} $$](/articles/aa/full_html/2025/09/aa55917-25/aa55917-25-eq5.gif) (5)
(5)
with a corresponding accreted mass of
![Mathematical equation: $$ \begin{aligned} M_{\rm acc}^\mathrm{quiesc}\mathrm{[UV-opt]} = 6.3\times 10^{-8}\,\mathrm{M}_\odot .\end{aligned} $$](/articles/aa/full_html/2025/09/aa55917-25/aa55917-25-eq6.gif) (6)
(6)
The sum of ![Mathematical equation: $ M_{\mathrm{acc}}^{\mathrm{SAP}}\mathrm{[UV-opt]} $](/articles/aa/full_html/2025/09/aa55917-25/aa55917-25-eq7.gif) and
and ![Mathematical equation: $ M_{\mathrm{acc}}^{\mathrm{quiesc}}\mathrm{[UV-opt]} $](/articles/aa/full_html/2025/09/aa55917-25/aa55917-25-eq8.gif) leads to Macc[UV − opt] = 3.2(±1.1) × 10−7 M⊙, as the mass (so far) accreted in the inter-outburst period. This value stems from the accretion luminosity radiated longword of 1700 Å, so it has clearly to be considered as a lower limit to the true effective value (see for ex. Skopal 2015). The mass needed to trigger the outburst in conditions resembling those of T CrB ranges over 0.2 − 2 × 10⁻⁶ M⊙ according to various theoretical models; for example, as reported in works by Yaron et al. (2005), Shen & Bildsten (2009), or Starrfield et al. (2025). These mass estimates greatly depend on the differences among the models and on the assumptions on the composition and radial structure of the underlying WD, how the chemical mixing between the accreted shell and the underlying WD actually takes place, the detailed chemical and isotopic composition of the matter accreted from the companion, and so forth. A key point worth noticing here is the satisfactory agreement between the accreted mass we derived above from the available observations and the value required by theoretical models to ignite an explosive outburst for the conditions prevailing in T CrB.
leads to Macc[UV − opt] = 3.2(±1.1) × 10−7 M⊙, as the mass (so far) accreted in the inter-outburst period. This value stems from the accretion luminosity radiated longword of 1700 Å, so it has clearly to be considered as a lower limit to the true effective value (see for ex. Skopal 2015). The mass needed to trigger the outburst in conditions resembling those of T CrB ranges over 0.2 − 2 × 10⁻⁶ M⊙ according to various theoretical models; for example, as reported in works by Yaron et al. (2005), Shen & Bildsten (2009), or Starrfield et al. (2025). These mass estimates greatly depend on the differences among the models and on the assumptions on the composition and radial structure of the underlying WD, how the chemical mixing between the accreted shell and the underlying WD actually takes place, the detailed chemical and isotopic composition of the matter accreted from the companion, and so forth. A key point worth noticing here is the satisfactory agreement between the accreted mass we derived above from the available observations and the value required by theoretical models to ignite an explosive outburst for the conditions prevailing in T CrB.
6. Orbital solution
We measured the radial velocity (RV) of the RG via cross-correlation on the high-resolution spectra of T CrB that we collected with the Asiago 1.82m + Echelle and SMARTS 1.5m + CHIRON telescopes. Table D.1 reports the results of our measurements. The template for cross-correlation was selected from the synthetic spectral library of Munari et al. (2005) for the resolving power 20 000, with atmospheric parameters Teff = 3500 K, log g = 1.5, [Fe/H] = 0.0, [α/H] = 0.0, and ζ = 2 km s−1. The choice of a synthetic spectrum nulls the combined effects of telluric absorptions, limited S/N, and errors in the wavelength calibration intrinsic to any RV standards observed nightly, along with the target. In addition, a synthetic spectrum also nulls the effect of the jitter caused by the atmosphere of a cool giant to be deeply convective, extended, and (ultimately) too unstable to serve as an accurate RV standard. To check for any offset to RVs that the choice of a synthetic spectrum could introduce, from the Gaia DR3 catalog we selected eight M2-M4 giants among those listed with the lowest uncertainty on their RV. We observed them with the Asiago 1.82m + Echelle telescope along with T CrB. Their RVs were derived via cross-correlation against the same synthetic template spectrum used for T CrB. The mean difference with the RV listed in Gaia DR3 is 0.10 ± 0.27 km s−1, confirming the absence of any systematic offset.
A spectroscopic orbit for the cool giant in T CrB was previously derived by Kenyon & Garcia (1986) and Fekel et al. (2000). Combining our RVs with theirs – and including the 1946-47 data of Sanford (1949) and the 1956-57 from Kraft (1958) – allowed us to cover a time-span of more than 28 200 days (∼124 orbits), well constraining the orbital parameters and the period in particular. The resulting orbital solution for the RG in T CrB is listed in Table 3 and overplotted to the data in Fig. 7. A null eccentricity is clearly supported by the data, in agreement with previous studies and we fixed it to 0 in deriving the orbit. The root mean square (rms) of the data from the orbital solution is 0.89 km s−1 for Chiron, 1.39 for Asiago, 1.08 for Kenyon & Garcia (1986), 1.25 for Fekel et al. (2000), 1.79 for Sanford (1949), and 1.24 for Kraft (1958).
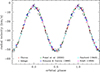 |
Fig. 7. Orbital solution derived in Table 3 overplotted to our Asiago and Chiron radial velocities and those of Sanford (1949), Kraft (1958), Kenyon & Garcia (1986), and Fekel et al. (2000). |
Spectroscopic orbit of the M3III in T CrB derived by combining our Asiago and Chiron radial velocities with those listed by Sanford (1949), Kraft (1958), Kenyon & Garcia (1986), and Fekel et al. (2000).
We performed rather extensive measurements of the emission lines present on our Echelle spectra of T CrB, recorded during the SAP, with the aim to trace (or at least constrain) the motion of the WD companion. The line profiles during the SAP are, however, highly variable and complex; in fact, they are so different from line to line with respect to the same orbital phase that no matter which way and into how many components they are deconvolved, a clean and unambiguous tracer of the WD motion could not be aptly identified. Several different absorption and emission components are superimposed along any given line of sight, which are apparently more responsive to the disk and hot spot brightness than to the orbital phase. This is clearly demonstrated by the atlases of line profiles presented in Appendix B, arranged according to the orbital phase, and covering the SAP phase from 2015-14-05 to 2023-06-01, and confirmed in Appendix C by the dense mapping in high resolution of the Hα profile that we carried out at ∼1-week cadence since the end of the SAP, from 2023-06-01 to 2025-05-01.
The lines grow in complexity of the emission profile and in the multiplicity of absorption components for orbital phases 0.4 to 0.8 (i.e., between the passage of the RG at descending quadrature and its transit at inferior conjunction). The line of sight during this phase interval traverses the densest and inner strata of the RG atmosphere, crosses the hot spot and the inflated outer rim of the disk around it, then aligns with the fraction of the accretion stream that may continue past the hot spot, before finally reaching the hottest inner radii of the disk; such a richness in terms of the emitting and absorbing bodies aligned along the line of sight, each one animated by broadly different and continuously varying radial velocities, clearly calls for highly complex and lively line profiles, and the atlases presented in Appendix B and Appendix C are a testimony to that.
The situation was apparently simpler during the long post-outburst quiescence (not covered by our observations that were triggered by T CrB entering the SAP), when Stanishev et al. (2004) were able to measure a sinusoidal motion from the Hα emission component, characterized by a lower amplitude and being in anti-phase with that of the RG, clearly supporting a WD that is appreciably more massive than the RG.
7. Radiative modeling
The accurate UBVRI photometry collected by ANS Collaboration, covering both the quiescence and SAP phases, enabled us to derive a detailed radiative model of T CrB. In this paper, we limit our analysis of the photometry to an assessment of the fraction of the Roche Lobe filled by the RG and to quantify the role and position of the hot spot in phase-reckoned light curves. The position relates to the azimuth, which, in turn, fixes the outer radius of the disk; the latter governs the maximum orbital inclination that avoids eclipsing the hot spot, ultimately affecting the mass of the red giant.
We adopted the same radiative modeling carried out by Munari (2023a) in computing the synthetic light curve of the secondary maximum during the 1946 outburst of T CrB. Its description is not repeated here, beyond noting that for the radial dependence of the temperature of the disk, we followed the standard profile  (cf. Warner 1995), where RWD and MWD are the radius and mass of the WD and
 ![Mathematical equation: $ T_0=[(3GM_{\mathrm{WD}}\dot{M})/(8\pi\sigma R^{3}_{\mathrm{WD}})]^{1/4} $](/articles/aa/full_html/2025/09/aa55917-25/aa55917-25-eq10.gif) relates to the Ṁ mass accretion flow through the disk. The masses of the RG and WD, along with the orbital inclination, have to satisfy the mass function 0.322 derived in the orbital solution of Table 3, with the orbital period and zero phase taken verbatim from it.
relates to the Ṁ mass accretion flow through the disk. The masses of the RG and WD, along with the orbital inclination, have to satisfy the mass function 0.322 derived in the orbital solution of Table 3, with the orbital period and zero phase taken verbatim from it.
A sample representation of the 3D view produced by our radiative modeling is shown in Fig. 8, relative to T CrB during the quiescence phase prior to the SAP, and separately for the passage of the RG at superior conjunction (phase 0.25) and descending quadrature (phase 0.5) for the parameters on the fourth line from top of Table 4 (providing the best fit to photometric light curves). The computed synthetic light curves are compared to the observed ones in Fig. 9, separately for quiescence (top panels) and the SAP phases (bottom panels). Concerning the main goals stated at the opening of this section, the results in Fig. 9 confirm that:
 |
Fig. 8. 3D views of T CrB in quiescence from the radiative modeling carried out in Sect. 7, for the RG filling completely its Roche lobe, the disk extending to the standard outer radius of twice its circularization value, an orbital inclination of 61 |

-
The RG fills completely its Roche lobe; even a modest underfilling by 3% would cause a drop by 0.10 mag of the overall brightness, which would be incompatible with the results given in Fig. 9. Maslennikova et al. (2023) concluded the same from modeling in the infrared.

Fig. 9. Light curve of T CrB, separately illustrated for quiescence and the SAP, fitted with the radiative modeling described in Sect. 7 and the same parameters leading up to the 3D view of Fig. 8. In the panels indicating the quiescence at the top, the two sets of fitting curves differ by the inclusion of the hot spot (following the parameters listed in Sect. 7). In the panels related to the SAP at the bottom, the solid curve is the fitting considering the full system, while the dot-dashed curve isolates the contribution of the sole RG.
-
The quiescent light curve constrains the azimuth of the hot spot (HS) to be 20 ± 10°; the effective angular dimension of the HS as seen from the WD is about 23°, with a peak temperature of 5910 K declining to 5080 K at the HS periphery.
-
The low temperature of the HS precludes it from being an important site of formation for HeII emission lines. This is in agreement with the results from the Doppler tomography performed by Planquart et al. (2025), which favors a formation scenario in the inner parts of the disk.
-
Coupled with the dynamic trajectory of the accretion stream, the ∼20° azimuth of HS implies that the outer radius, ro, of the disk extends to twice the circularization radius, rc, as expected in a standard disk (Warner 1995). An outer radius equal to rc would move the azimuth of the HS to ∼53°, and to ∼159° if it were equal to the minimum represented by the intercept radius ri (cf. Table 4).
-
The HS irradiates the facing side of the RG, rising the surface temperature from 3500 K to a peak value of 3560 K reached at the sub-HS point (yellowish color in Fig. 8). It also irradiates the closer portion of the disk, slightly raising the local temperature above that corresponding to the pure accretion flow (purple-to-pink color in Fig. 8).
-
No matter the actual value of Ṁ, in quiescence, the outer parts of the disk remain much cooler than the surface of the RG and completely neutral. In spite of their large angular extent (similar to that of the RG), they do not appreciably contribute to the overall brightness of T CrB at optical wavelengths.
-
The HS contributes significantly to the overall brightness of T CrB in quiescence even in the V and R bands. This fact strongly supports the counter-intuitive results by Munari et al. (2021) and Merc et al. (2024) for the detectability of flickering in symbiotic stars (SySts). Merc et al. (2024) was able to isolate flickering signatures from TESS ultra-precise observations of SySts from space, in spite of the fact that TESS observes at red wavelengths should therefore be primarily dominated by the direct emission from the RG. Thanks to highly-accurate, ground-based photometry in the B band, Munari et al. (2021) have been able to detect flickering at a few milli-mag level from SySts accreting at such low levels that their nature is betrayed by a faible emission in Hα which becomes visible on high-resolution spectra only after the careful subtraction of a template spectrum for the RG.
-
The HS plays such an important role in shaping the light curve of T CrB that any change in its brightness or in the radius of the disk (and therefore in the azimuth of HS) would significantly alter the times of passage at minimum system brightness. The HS variability developing on long timescales, as those reported by Stanishev et al. (2004), could impact attempts to detect a change in the orbital period by comparing minima in the light curves before and after the 1946 outburst.
-
A large-amplitude flickering was observed at each of the many visits paid to T CrB during quiescence, implying that the HS is not eclipsed. The maximum orbital inclination that still avoids eclipses of the HS by the RG is 61.5°. From the 0.322 mass function and for a WD mass of ∼1.35 M⊙ (as generally adopted in theoretical models of T CrB), such an orbital inclination returns a mass of 0.93 M⊙ for the RG (cf. Table 4). This is well below the typical mass for a field, single M3III giant (e.g. Cox 2000). Given the Roche-lobe filling status of the RG, much of the missing mass could have been transferred to the WD and retained there to favor its growth toward the Chandrasekhar limit. In accordance with the high retention efficiency ([Macc − Mej]/Macc) recently discovered by Starrfield et al. (2025), the numerous nova outbursts that T CrB has undergone in its life have clearly not altered the mass-gaining path followed by the WD.
-
The accretion disk, which remains faint during quiescence, instead dominates the light curve during the SAP, contributing significantly even in the I band to the overall brightness. During the SAP, the relative importance of the HS on the system brightness is greatly diminished compared to quiescence. An HS similar to quiescence may still be present during the SAP, as expected considering that the RG keeps spilling mass via L1 even during the SAP. However, the fact that during the SAP, the HS does not turn brighter than quiescence implies that SAP is not triggered by an increased mass-loss rate of the RG; instead, it is caused by a radial collapse of the disk that enhances the mass-flow toward the innermost radii and ultimately toward the WD.
-
In this interpretation, the initial ∼70 years of the ∼80 year intra-outburst period are primarily spent in building up mass in the disk. This mass is then flushed toward the WD primarily during the last ∼10 yr of the intra-outburst period, giving rise to SAP-like events.
-
The radial collapse of the disk seems to propagate to the outer regions at later epochs. In fact, the I-band light curve on the right panel of Fig. 1 maintains the SAP level well through the deep-minimum phase, until mid 2024 when it drops to the value of the bare RG, simultaneously with the reprisal in brightness at shorter wavelengths powered by a regain in the mass flow at inner radii.
8. Rotational velocity
Zamanov et al. (2006, 2007) derived the rotational velocity of the RG in symbiotic stars from the width of absorption lines measured on FEROS spectra obtained at 48 000 resolving power. They inferred that ∼90% of the S-type RGs have Vrot sin i in the interval 4.5–11.7 km s−1, rotating faster than single field giants of similar spectral type and corotating (synchronized) with the orbital revolution. From their infrared spectra recorded at 44 000 resolving power, Fekel et al. (2004) derived for the RG of T CrB a rotational velocity Vrot sin i = 5.1 km s−1, while Hinkle et al. (2025) obtained Vrot sin i = 8.7 km s−1 from optical spectra at a low 15 000 resolving power.
Our Chiron spectrum for 2022-08-16 was recorded at a much higher resolving power than either Fekel et al. (2004) and Hinkle et al. (2025), allowing us to derive a more accurate value of Vrot sin i. For an instrumental line-spread function (LSF) with a Gaussian shape and for low rotational velocity, the observed width of stellar lines can be expressed as
 (7)
(7)
where σξ is the microturbolent velocity. For the M3III giant in T CrB, Wallerstein et al. (2008) derived σξ = 2 km s−1.
Isolated telluric lines provide an efficient way to estimate σLSF because they illuminate the spectrograph slit in exactly the same way as the stellar seeing disk. This provides a more accurate estimate than using lines from the comparison lamp or the sky background, which illuminates the slit uniformly. Usually σLSF degrades moving away from the center of the spectrograph’s optical path because of aberrations, so to exploit the best Chiron resolving power we looked for the telluric O2 band centered at 6278 Å that is recorded by Chiron close to the center of the central order (N.48). From seven unblended lines belonging to the O2 telluric band, we derived σLSF = 0.0306 ± 0.0030 corresponding to a local resolving power of λ/Δλ = 87 200.
The width of stellar lines σobs must obviously be measured at the same position of the telluric lines used to estimate σLSF to exploit similar optical performance by the spectrograph. From ten isolated stellar lines interspersed with the O2 telluric ones, we derived σobs = 0.1124 ± 0.0089, from which we finally obtained: Vrot sin i = 4.75 ± 0.26 km s−1. For an inclination of i = 61.5°, this velocity corresponds to corotation at a stellar radius of 24.3 R⊙. From the radiative modeling in Sect. 7, the radius of the RG filling its Roche lobe is ∼71 R⊙ (cf. the fifth column of Table 4), for which the corotation velocity would be Vrot = 16.0 km s−1. Thus, the RG in T CrB is far from corotation conditions, as if the outer layers of the RG are removed via spilling through L1 at a rate faster than it is required to achieve corotation. In fact, the theoretical timescale for synchronization would be just a few hundreds years following Zamanov et al. (2007); this is several orders of magnitude shorter than the time spent by T CrB in the symbiotic mass-transfer phase.
9. Conclusions
The large body of multi-wavelength observations assembled for T CrB both during the quiescence following the 1946 outburst (in particular, during the recent 2015–2023 enhanced mass-transfer phase), taken together with the results of orbital solution and radiative modeling, have allowed us to draw a consistent picture of T CrB and how its WD accretes the mass that is required to trigger the outburst.
The RG completely fills its Roche lobe and it is not corotating, which is a possible consequence of the continuous removal of its outer layers by the incessant spilling through L1. The material lost by the RG goes to form a disk around the WD. The ∼20° azimuth of the bright hot spot formed by the impacting accretion stream fixes the outer radius of the disk to ∼58 R⊙, twice the circularization radius as in the standard theory of accretion disks. The hot spot is not eclipsed and its 23° angular extension and mild temperature (5900 K degrading to 5100 K at the periphery) make it amply visible in the light curve of T CrB even at V and R bands. For a WD of 1.35 M⊙, the orbital and radiative modeling return an inclination of 61° and a mass of 0.93 M⊙ for the RG, making the mass transfer dynamically stable. The RG has been stripped out of the outer 0.3–0.5 solar masses, exposing to mass transfer toward the WD the internal layers, whose composition (chemical and isotopic) is expected to significantly differ from the Solar mixture generally assumed in theoretical models of the outburst.
The hot spot did not brighten during the enhanced mass-transfer phase, indicating that the SAP is not triggered by an increase in the mass loss from the RG but is instead caused by the inside-out collapse of the accretion disk grown in mass beyond the stable configuration. The disk appears to be spending the initial ∼70 of the ∼80 yr intra-outburst period mainly to grown in mass, transferring only a limited amount of what it is gaining to the WD; it is only during the last ∼10 of the ∼80 yr intra-outburst interval that most of the mass transfer to the WD takes place in a 4:1 proportion and at a mean rate that is ∼28 faster than in quiescence.
Comparing with the enhanced mass-transfer phase that preceded the 1946 outburst, the present one attained a lower brightness, suggesting that a lower amount of mass has been transferred from the disk to the WD. This could justify the delay affecting the outburst, which still had not yet occurred two full years past the end of the enhanced mass-transfer phase; whereas in 1946, it followed just six months after.
While the inner parts of the disk emptied during the enhanced mass-transfer phase ending in late April 2023, the outer parts started migrating inward and from about May 2024 they began restoring the mass-flow at shorter radii with the noticeable effect that the brightness of T CrB in the optical and UV rose back to levels higher than in quiescence. The consequent revamp in the accretion rate toward the WD could fill any deficit left over by the underluminous 2015–2023 enhanced mass-transfer phase and, ultimately, leading the shell accumulated on the surface of the WD to reach ignition conditions. The material restoring the mass-flow at the inner radii of the disk migrated inward from the outer parts of the disk, which radiates primarily in the far red/IR. In fact, simultaneously with the rebrightening in the blue and UV that started in May 2024, T CrB became fainter in the I band, nearly down to the brightness level of the bare red giant.
Data availability
Full Tables 1 and A.1 are available at the CDS via https://cdsarc.cds.unistra.fr/viz-bin/cat/J/A+A/701/A176
Acknowledgments
We acknowledge the anonymous Referee for useful and constructive comments. This work has been in part supported by INAF 2023 MiniGrant Program (contract C93C23008470001 to UM). NM acknowledges financial support through ASI-INAF and ‘Mainstream’ agreement 2017-14-H.0 (PI: T. Belloni). This work has made use of data provided by Digital Access to a Sky Century @ Harvard (DASCH), which has been partially supported by NSF grants AST-0407380, AST-0909073, and AST-1313370. Work on DASCH Data Release 7 received support from the Smithsonian American Women’s History Initiative Pool. Part of this work is based on archival data, software or online services provided by the Space Science Data Center - ASI.
References
- Anupama, G. C., & Prabhu, T. P. 1991, MNRAS, 253, 605 [Google Scholar]
- Bessell, M. S., Castelli, F., & Plez, B. 1998, A&A, 333, 231 [NASA ADS] [Google Scholar]
- Blackburn, J. K. 1995, in Astronomical Data Analysis Software and Systems IV, eds. R. A. Shaw, H. E. Payne, & J. J. E. Hayes, ASP Conf. Ser., 77, 367 [Google Scholar]
- Breeveld, A. A., Landsman, W., Holland, S. T., et al. 2011, in Gamma Ray Bursts 2010,, eds. J. E. McEnery, J. L. Racusin, & N. Gehrels (AIP), AIP Conf. Ser., 1358, 373 [Google Scholar]
- Cassatella, A., Patriarchi, P., Selvelli, P. L., et al. 1982, in Third European IUE Conference, eds. E. Rolfe ,& A. Heck, ESA Spec. Pub., 176, 229 [Google Scholar]
- Cox, A. N. 2000, Allen’s Astrophysical Quantities (Springer) [Google Scholar]
- Dobrotka, A., Hric, L., Casares, J., et al. 2010, MNRAS, 402, 2567 [Google Scholar]
- Fekel, F. C., Joyce, R. R., Hinkle, K. H., & Skrutskie, M. F. 2000, AJ, 119, 1375 [NASA ADS] [CrossRef] [Google Scholar]
- Fekel, F. C., Hinkle, K. H., & Joyce, R. R. 2004, in Stellar Rotation, eds. A. Maeder, & P. Eenens, IAU Symp., 215, 168 [Google Scholar]
- Gaia Collaboration 2016, A&A, 595, A1 [NASA ADS] [CrossRef] [EDP Sciences] [Google Scholar]
- Gaia Collaboration 2023, A&A, 674, A1 [NASA ADS] [CrossRef] [EDP Sciences] [Google Scholar]
- Gehrels, N., Chincarini, G., Giommi, P., et al. 2004, ApJ, 611, 1005 [Google Scholar]
- Grindlay, J., Tang, S., Los, E., & Servillat, M. 2012, in New Horizons in Time Domain Astronomy, eds. E. Griffin, R. Hanisch, & R. Seaman, IAU Symp., 285, 29 [NASA ADS] [Google Scholar]
- Henden, A., & Munari, U. 2006, A&A, 458, 339 [NASA ADS] [CrossRef] [EDP Sciences] [Google Scholar]
- Henden, A., & Munari, U. 2008, Balt. Astron., 17, 293 [Google Scholar]
- Hinkle, K. H., Nagarajan, P., Fekel, F. C., et al. 2025, ApJ, 983, 76 [Google Scholar]
- Hric, L., Petrik, K., Urban, Z., Niarchos, P., & Anupama, G. C. 1998, A&A, 339, 449 [Google Scholar]
- Iijima, T. 1990, J. AAVSO, 19, 28 [Google Scholar]
- Kenyon, S. J. 1986, The Symbiotic Stars (Cambridge Univ. Press) [Google Scholar]
- Kenyon, S. J., & Garcia, M. R. 1986, AJ, 91, 125 [Google Scholar]
- Kraft, R. P. 1958, ApJ, 127, 625 [NASA ADS] [CrossRef] [Google Scholar]
- Kukarkin, B. V. 1946, IAU Circ., 1038, 1 [Google Scholar]
- Landolt, A. U. 1992, AJ, 104, 340 [Google Scholar]
- Landolt, A. U. 2009, AJ, 137, 4186 [Google Scholar]
- Luna, G. J. M., Sokoloski, J. L., Mukai, K., & Kuin, M. 2020, ApJ, 902, L14 [NASA ADS] [CrossRef] [Google Scholar]
- Maslennikova, N. A., Tatarnikov, A. M., Tatarnikova, A. A., et al. 2023, Astron. Lett., 49, 501 [Google Scholar]
- Merc, J., Beck, P. G., Mathur, S., & García, R. A. 2024, A&A, 683, A84 [NASA ADS] [CrossRef] [EDP Sciences] [Google Scholar]
- Merc, J., Wyrzykowski, Ł., Beck, P. G., et al. 2025, MNRAS, 541, L14 [Google Scholar]
- Munari, U. 2023a, Res. Notes Am. Astron. Soc., 7, 251 [Google Scholar]
- Munari, U. 2023b, Res. Notes Am. Astron. Soc., 7, 145 [Google Scholar]
- Munari, U. 2025, Contrib. Astron. Obs. Skalnate Pleso, 55, 47 [Google Scholar]
- Munari, U., & Moretti, S. 2012, Balt. Astron., 21, 22 [Google Scholar]
- Munari, U., & Zwitter, T. 1997, A&A, 318, 269 [NASA ADS] [Google Scholar]
- Munari, U., Yudin, B. F., Taranova, O. G., et al. 1992, A&AS, 93, 383 [NASA ADS] [Google Scholar]
- Munari, U., Sordo, R., Castelli, F., & Zwitter, T. 2005, A&A, 442, 1127 [NASA ADS] [CrossRef] [EDP Sciences] [Google Scholar]
- Munari, U., Bacci, S., Baldinelli, L., et al. 2012, Balt. Astron., 21, 13 [NASA ADS] [Google Scholar]
- Munari, U., Dallaporta, S., & Cherini, G. 2016, New A, 47, 7 [Google Scholar]
- Munari, U., Traven, G., Masetti, N., et al. 2021, MNRAS, 505, 6121 [NASA ADS] [CrossRef] [Google Scholar]
- Nikolov, Y. 2022, New Astron., 97, 101859 [NASA ADS] [CrossRef] [Google Scholar]
- Page, M. J., Kuin, N. P. M., Breeveld, A. A., et al. 2013, MNRAS, 436, 1684 [Google Scholar]
- Payne-Gaposchkin, C., & Wright, F. W. 1946, ApJ, 104, 75 [Google Scholar]
- Planquart, L., Jorissen, A., & Van Winckel, H. 2025, A&A, 694, A85 [NASA ADS] [CrossRef] [EDP Sciences] [Google Scholar]
- Poole, T. S., Breeveld, A. A., Page, M. J., et al. 2008, MNRAS, 383, 627 [Google Scholar]
- Raikova, D., & Antov, A. 1986, Inf. Bull. Var. Stars, 2960, 1 [Google Scholar]
- Roming, P. W. A., Kennedy, T. E., Mason, K. O., et al. 2005, Space Sci. Rev., 120, 95 [Google Scholar]
- Sanford, R. F. 1949, ApJ, 109, 81 [NASA ADS] [CrossRef] [Google Scholar]
- Schaefer, B. E. 2023a, MNRAS, 524, 3146 [NASA ADS] [CrossRef] [Google Scholar]
- Schaefer, B. E. 2023b, J. Hist. Astron., 54, 436 [CrossRef] [Google Scholar]
- Schlafly, E. F., & Finkbeiner, D. P. 2011, ApJ, 737, 103 [Google Scholar]
- Shears, J. H. 2024, Res. Notes Am. Astron. Soc., 8, 233 [Google Scholar]
- Shen, K. J., & Bildsten, L. 2009, ApJ, 692, 324 [Google Scholar]
- Skopal, A. 2015, New A, 36, 116 [Google Scholar]
- Sokoloski, J. L., Bildsten, L., & Ho, W. C. G. 2001, MNRAS, 326, 553 [NASA ADS] [CrossRef] [Google Scholar]
- Stanishev, V., Zamanov, R., Tomov, N., & Marziani, P. 2004, A&A, 415, 609 [NASA ADS] [CrossRef] [EDP Sciences] [Google Scholar]
- Starrfield, S., Bose, M., Woodward, C. E., et al. 2025, ApJ, 982, 89 [Google Scholar]
- Teyssier, F., Sims, F., Guarro, J., Bertand, E., & Shore, S. N. 2024, ATel, 16912, 1 [Google Scholar]
- Tokovinin, A., Fischer, D. A., Bonati, M., et al. 2013, PASP, 125, 1336 [NASA ADS] [CrossRef] [Google Scholar]
- Wallerstein, G., Harrison, T., Munari, U., & Vanture, A. 2008, PASP, 120, 492 [Google Scholar]
- Warner, B. 1995, Cataclysmic Variable Stars, 28 (Cambridge Univ. Press) [Google Scholar]
- Yaron, O., Prialnik, D., Shara, M. M., & Kovetz, A. 2005, ApJ, 623, 398 [Google Scholar]
- Zamanov, R. K., & Zamanova, V. I. 1997, Inf. Bull. Var. Stars, 4461, 1 [Google Scholar]
- Zamanov, R., Bode, M. F., Stanishev, V., & Martí, J. 2004, MNRAS, 350, 1477 [Google Scholar]
- Zamanov, R. K., Bode, M. F., Melo, C. H. F., et al. 2006, MNRAS, 365, 1215 [Google Scholar]
- Zamanov, R. K., Bode, M. F., Melo, C. H. F., et al. 2007, MNRAS, 380, 1053 [NASA ADS] [CrossRef] [Google Scholar]
- Zamanov, R., Boeva, S., Latev, G. Y., et al. 2023, A&A, 680, L18 [NASA ADS] [CrossRef] [EDP Sciences] [Google Scholar]
- Zwitter, T., & Munari, U. 1995, A&AS, 114, 575 [NASA ADS] [Google Scholar]
Appendix A: Swift UVOT observations of T CrB
To trace the evolution of T CrB in the near-UV, we selected a series of pointings performed over nearly two decades, between 2008 and 2025, with the UltraViolet Optical Telescope (UVOT; Roming et al. 2005) on board the Neil GehrelsSwift satellite (Gehrels et al. 2004), which observed in the UVW1 (2600 Å), UVM2 (2246 Å), and UVW2 (1928 Å) filters. See Sect. 2.3 for details about the measurements of these data presented in Table A.1 (available in electronic format only through the CDS).
Appendix B: Atlas of high-resolution emission line profiles of T CrB in the SAP
In this appendix, we present an atlas of high-resolution profiles of selected emission lines (Hα, Hβ, HeII 4686, HeI 5876, HeI 6678, and [OIII] 5007), obtained with the Asiago 1.82m + Echelle and CTIO 1.55m + Chiron telescopes, covering the SAP phase of T CrB from April 2015 to June 2023. All spectra have been continuum normalized and are plotted on the same ordinate scale for an easier comparison, ordered by orbital phase. The orbital phase quoted for each spectrum has been computed according to the to the orbital solution given in Table 3, where phase 0.0 corresponds to the passage of the RG at the ascending quadrature (maximum RG velocity).
 |
Fig. B.1. High-resolution Hα emission line profiles of T CrB during the SAP from Asiago 1.82m + Echelle and SMARTS 1.55 + Chiron observations. |
 |
Fig. B.2. High-resolution Hβ emission line profiles of T CrB during the SAP from Asiago 1.82m + Echelle and SMARTS 1.55 + Chiron observations. |
 |
Fig. B.3. High-resolution HeII 4686Å emission line profiles of T CrB during the SAP from Asiago 1.82m + Echelle and SMARTS 1.55 + Chiron observations. |
 |
Fig. B.4. High-resolution HeI 5876Å emission line profiles of T CrB during the SAP from Asiago 1.82m + Echelle and SMARTS 1.55 + Chiron observations. |
 |
Fig. B.5. High-resolution HeI 6768Å emission line profiles of T CrB during the SAP from Asiago 1.82m + Echelle and SMARTS 1.55 + Chiron observations. The occasional dent on the blue side of the line is caused by imperfect conjunction of adjacent Echelle orders. |
 |
Fig. B.6. High-resolution [OIII] 5007Å emission line profiles of T CrB during the SAP from Asiago 1.82m + Echelle and SMARTS 1.55 + Chiron observations. |
Appendix C: Atlas of high-resolution profiles for Hα of T CrB during post-SAP and recovery phases
In this appendix, we present a selection of high-resolution profiles for the Hα emission line of T CrB, obtained with the Varese 0.84m telescope + Multi-Mode Echelle spectrograph at a resolving power of 12,000. These profiles cover the post-SAP evolution of Hα to present time, and thus extend the time coverage of Fig. B.1 that focuses on the SAP phase alone.
To derive clean profiles, for all the observations presented in this image, we subtracted from the original spectra the spectrum of a template M3III giant obtained with the same telescope, shifted to the epoch velocity of the red giant in T CrB. The template spectrum is shown for reference at the bottom of the panels. Such a subtraction is particularly important to reconstruct the true profile at the time of the weakest emission in Hα, during the deep-minimum phase discussed in Sect. 4.3.
The spectra, distributed over three orbits, are aligned on the three panels at the same orbital phase for ease of comparison (phase 0.0 corresponding to passage of the red giant at ascending quadrature, as per Table 3).
The upper right box illustrates (at a more dense time mapping) the rapid spectral Hα evolution during the November 2024 flare (cf. Sect. 4.4). The same flare is well visible also in the evolution of all other emission lines and particularly in HeII 4686. For sake of completeness, the bottom left box shows some spectra recorded with Asiago and CTIO telescopes in the first six months of the post-SAP period, before the monitoring with the Varese 0.84m telescope could begin.
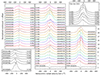 |
Fig. C.1. Evolution of the profile of Hα emission line during the post-SAP phase of T CrB, from Echelle observations collected with the Varese 0.84m telescope. The dashed vertical line marks the barycentric velocity of the system. |
Appendix D: Radial velocity measurements of the cool giant in T CrB
We report here the heliocentric radial velocity (RV) of the RG that has been measured via cross-correlation on the high-resolution spectra of T CrB that we collected with the Asiago 1.82m + Echelle and SMARTS 1.5m + CHIRON telescopes. The template for cross-correlation was selected from the synthetic spectral library of Munari et al. (2005) for the resolving power 20,000, with atmospheric parameters Teff = 3500 K, log g = 1.5, [Fe/H] = 0.0, [α/H] = 0.0, ζ = 2 km s−1.
Radial velocities of the cool giant in T CrB.
All Tables
Integrated HeII 4686 emission line fluxes (in units of 10−13 erg cm−2 s−1) for the flare T CrB underwent in November 2024.
Spectroscopic orbit of the M3III in T CrB derived by combining our Asiago and Chiron radial velocities with those listed by Sanford (1949), Kraft (1958), Kenyon & Garcia (1986), and Fekel et al. (2000).
All Figures
|
Fig. 1. Photometric evolution of T CrB over the last 20 years, with the panels at right zooming on the last four orbital revolutions. The UBVRI data are from the ANS Collaboration monitoring program, M2 is the UVOT band from the Swift satellite, and the flux of the HeII 4686 emission line is expressed in magnitudes relative to the peak value (Fmax = 4.42 × 10⁻¹² erg cm−2 s−1; see Sect. 4 for details). The continuous curves at right is the light curve in that band of the bare, ellipsoidal distorted red giant without contribution from the stream, the hot spot, and the accretion disk (see the radiative modeling in Sect. 7 for details). |
| In the text | |
|
Fig. 2. Part of the Chiron spectrum of T CrB for 2022-08-16, recorded in slicer mode for a resolving power of ∼78 000. The NaI line at 5890 Å is de-convolved into the stellar component (at −28.5 km s−1 heliocentric velocity) and additional two of interstellar origin (at −22.0 and −15.0 km s−1), with an indication of the corresponding interstellar reddening. |
| In the text | |
|
Fig. 3. Detection of the presence of weak emission lines in the spectra of T CrB based on subtracting the scaled spectrum of an M3III template. Top panel: Portion of Asiago 1.22m + B&C + 300 ln/mm spectra of T CrB and the M3III template HD 112300. Lower panel: Subtracted spectrum revealing the presence of emission lines other than Hβ. The ordinates are given in 10−13 erg cm−2 s−1 Å−1 in both panels. |
| In the text | |
|
Fig. 4. Spectra of T CrB collected with the Asiago 1.22m telescope selected for being representative of the evolutionary phases T CrB has gone through during the last 20 years, as discussed in Sect. 4. |
| In the text | |
|
Fig. 5. Comparison between the SAP phase that T CrB underwent prior to the 1946 outburst and the 2015–2023 recent one. |
| In the text | |
|
Fig. 6. Examples of the spectral energy distribution of T CrB from quiescence (2008-2011) to SAP peak (2016), and for reference that of the M3III template HD 112300, plotted in black and scaled to the distance of T CrB. Quoted LUV and Lopt are the accretion luminosities (in L⊙) radiated over the 1700–3500 and 3500–8000 Å intervals, respectively. Note on the SED for 2008–2011 the effect of the red-leak affecting the Swift W2 filter. |
| In the text | |
|
Fig. 7. Orbital solution derived in Table 3 overplotted to our Asiago and Chiron radial velocities and those of Sanford (1949), Kraft (1958), Kenyon & Garcia (1986), and Fekel et al. (2000). |
| In the text | |
|
Fig. 8. 3D views of T CrB in quiescence from the radiative modeling carried out in Sect. 7, for the RG filling completely its Roche lobe, the disk extending to the standard outer radius of twice its circularization value, an orbital inclination of 61 |
| In the text | |
|
Fig. 9. Light curve of T CrB, separately illustrated for quiescence and the SAP, fitted with the radiative modeling described in Sect. 7 and the same parameters leading up to the 3D view of Fig. 8. In the panels indicating the quiescence at the top, the two sets of fitting curves differ by the inclusion of the hot spot (following the parameters listed in Sect. 7). In the panels related to the SAP at the bottom, the solid curve is the fitting considering the full system, while the dot-dashed curve isolates the contribution of the sole RG. |
| In the text | |
|
Fig. B.1. High-resolution Hα emission line profiles of T CrB during the SAP from Asiago 1.82m + Echelle and SMARTS 1.55 + Chiron observations. |
| In the text | |
|
Fig. B.2. High-resolution Hβ emission line profiles of T CrB during the SAP from Asiago 1.82m + Echelle and SMARTS 1.55 + Chiron observations. |
| In the text | |
|
Fig. B.3. High-resolution HeII 4686Å emission line profiles of T CrB during the SAP from Asiago 1.82m + Echelle and SMARTS 1.55 + Chiron observations. |
| In the text | |
|
Fig. B.4. High-resolution HeI 5876Å emission line profiles of T CrB during the SAP from Asiago 1.82m + Echelle and SMARTS 1.55 + Chiron observations. |
| In the text | |
|
Fig. B.5. High-resolution HeI 6768Å emission line profiles of T CrB during the SAP from Asiago 1.82m + Echelle and SMARTS 1.55 + Chiron observations. The occasional dent on the blue side of the line is caused by imperfect conjunction of adjacent Echelle orders. |
| In the text | |
|
Fig. B.6. High-resolution [OIII] 5007Å emission line profiles of T CrB during the SAP from Asiago 1.82m + Echelle and SMARTS 1.55 + Chiron observations. |
| In the text | |
|
Fig. C.1. Evolution of the profile of Hα emission line during the post-SAP phase of T CrB, from Echelle observations collected with the Varese 0.84m telescope. The dashed vertical line marks the barycentric velocity of the system. |
| In the text | |
Current usage metrics show cumulative count of Article Views (full-text article views including HTML views, PDF and ePub downloads, according to the available data) and Abstracts Views on Vision4Press platform.
Data correspond to usage on the plateform after 2015. The current usage metrics is available 48-96 hours after online publication and is updated daily on week days.
Initial download of the metrics may take a while.