Open Access
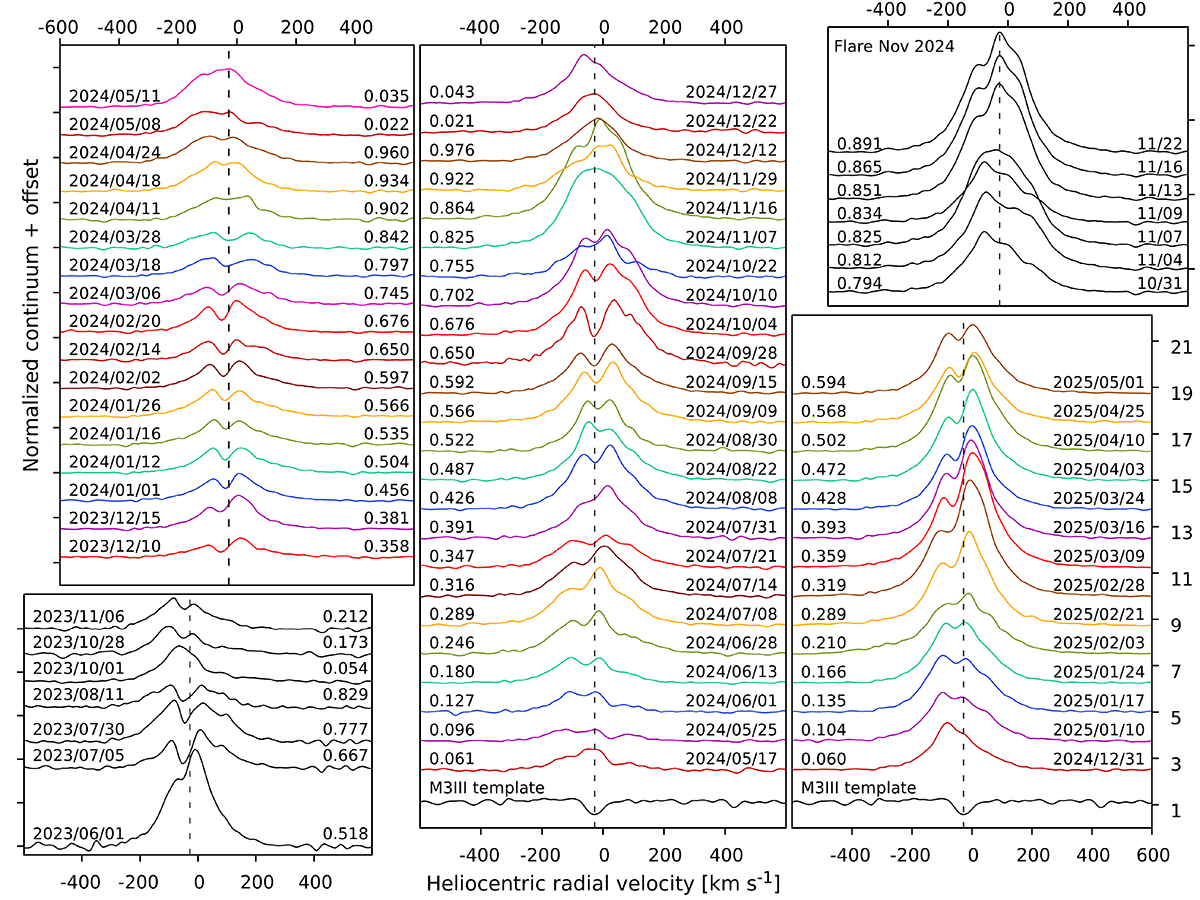
Fig. C.1.
Download original image
Evolution of the profile of Hα emission line during the post-SAP phase of T CrB, from Echelle observations collected with the Varese 0.84m telescope. The dashed vertical line marks the barycentric velocity of the system.
Current usage metrics show cumulative count of Article Views (full-text article views including HTML views, PDF and ePub downloads, according to the available data) and Abstracts Views on Vision4Press platform.
Data correspond to usage on the plateform after 2015. The current usage metrics is available 48-96 hours after online publication and is updated daily on week days.
Initial download of the metrics may take a while.