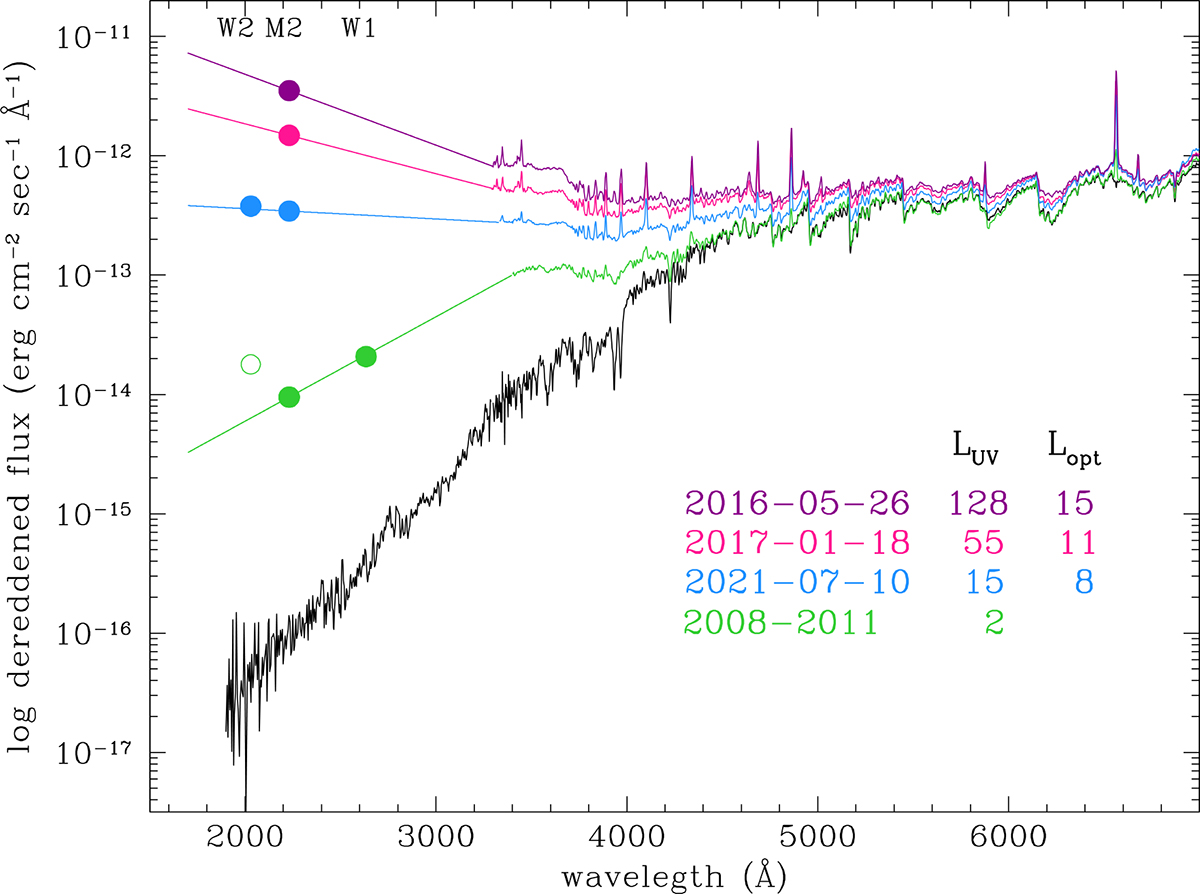
Fig. 6.
Download original image
Examples of the spectral energy distribution of T CrB from quiescence (2008-2011) to SAP peak (2016), and for reference that of the M3III template HD 112300, plotted in black and scaled to the distance of T CrB. Quoted LUV and Lopt are the accretion luminosities (in L⊙) radiated over the 1700–3500 and 3500–8000 Å intervals, respectively. Note on the SED for 2008–2011 the effect of the red-leak affecting the Swift W2 filter.
Current usage metrics show cumulative count of Article Views (full-text article views including HTML views, PDF and ePub downloads, according to the available data) and Abstracts Views on Vision4Press platform.
Data correspond to usage on the plateform after 2015. The current usage metrics is available 48-96 hours after online publication and is updated daily on week days.
Initial download of the metrics may take a while.