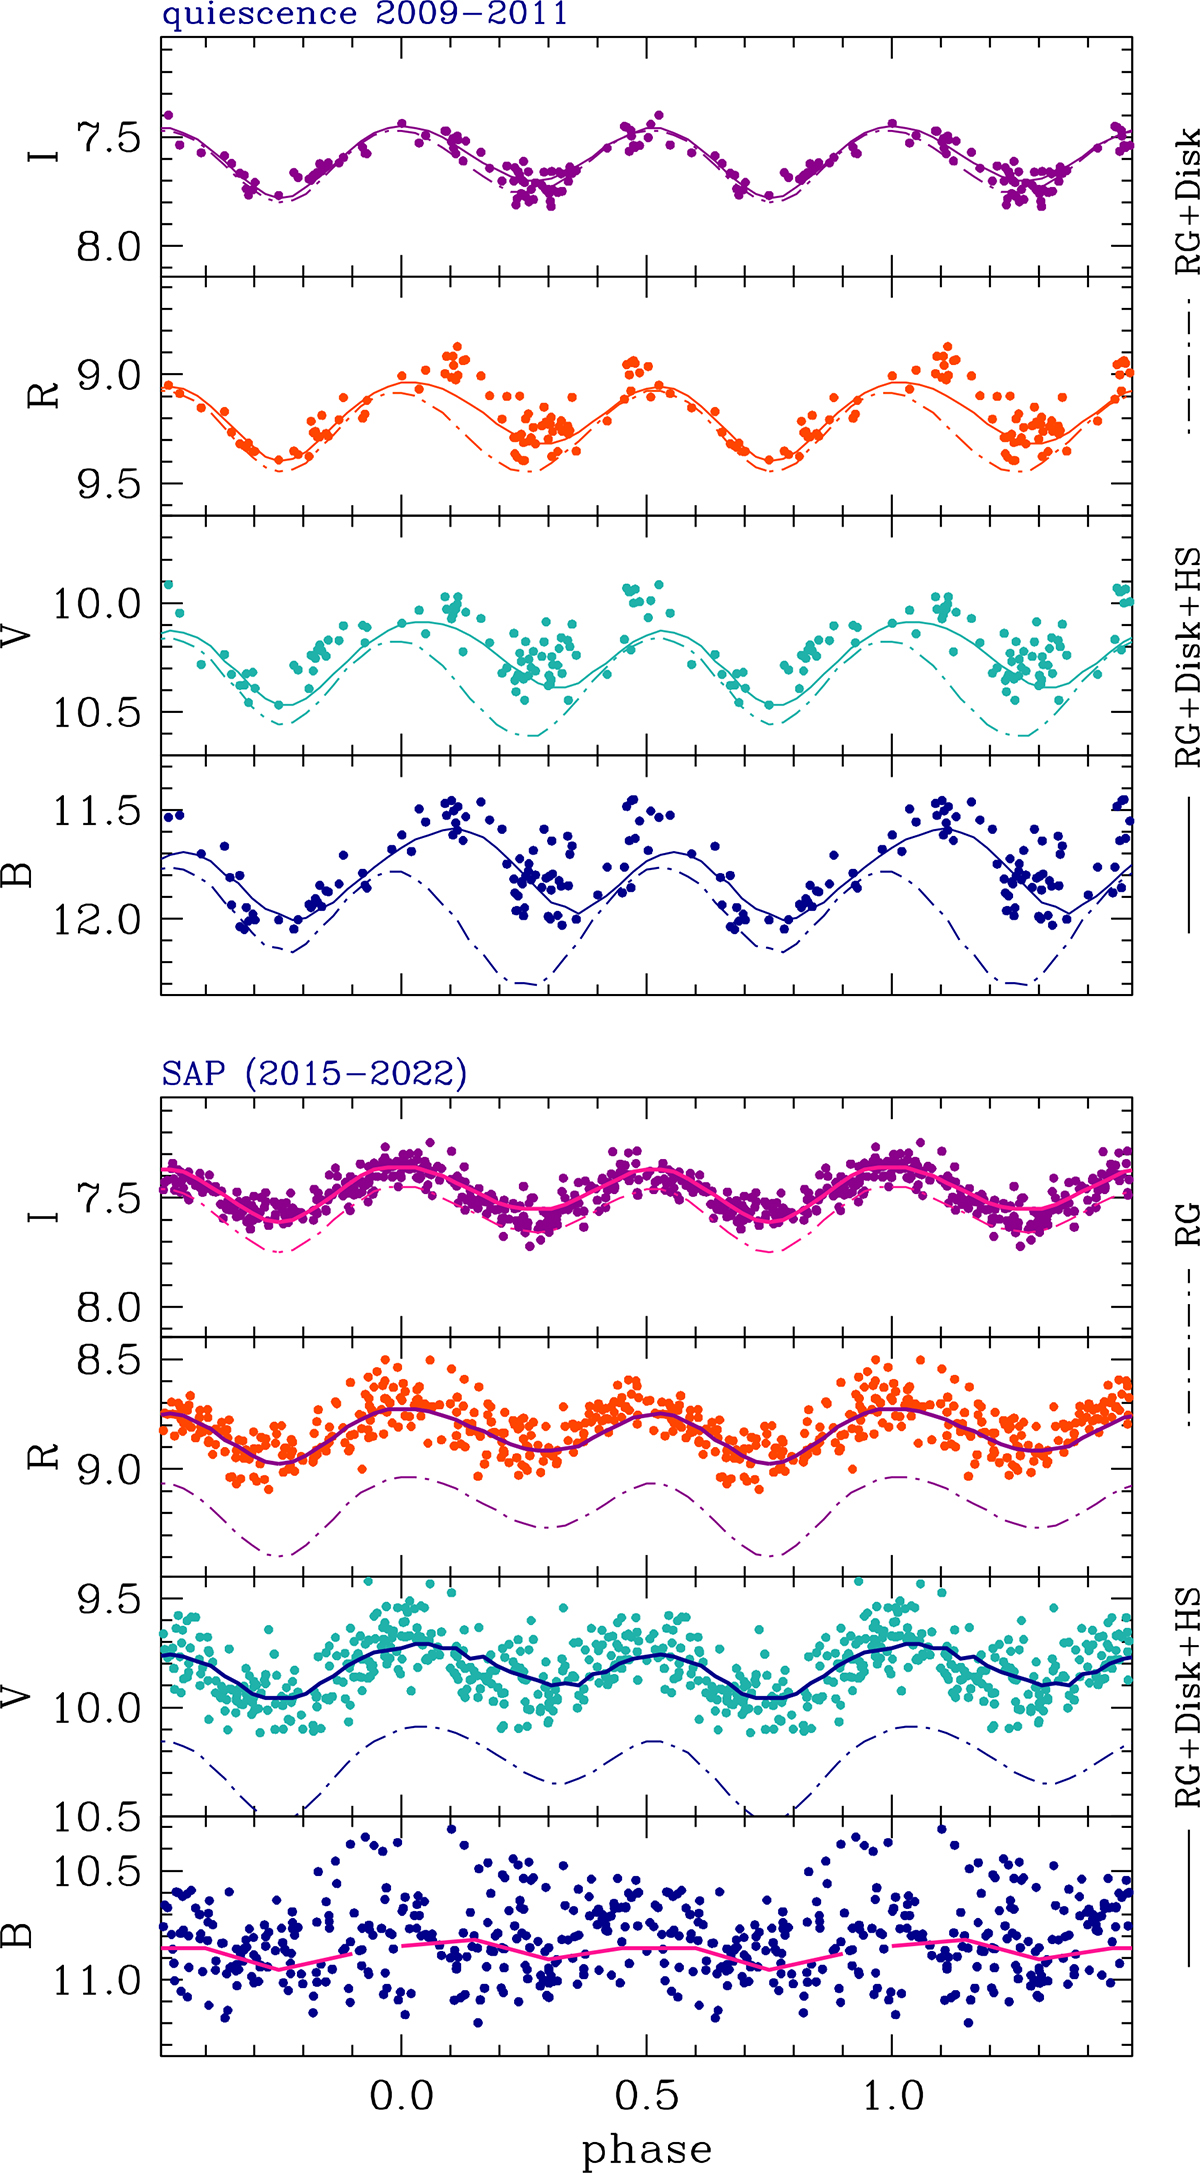
Fig. 9.
Download original image
Light curve of T CrB, separately illustrated for quiescence and the SAP, fitted with the radiative modeling described in Sect. 7 and the same parameters leading up to the 3D view of Fig. 8. In the panels indicating the quiescence at the top, the two sets of fitting curves differ by the inclusion of the hot spot (following the parameters listed in Sect. 7). In the panels related to the SAP at the bottom, the solid curve is the fitting considering the full system, while the dot-dashed curve isolates the contribution of the sole RG.
Current usage metrics show cumulative count of Article Views (full-text article views including HTML views, PDF and ePub downloads, according to the available data) and Abstracts Views on Vision4Press platform.
Data correspond to usage on the plateform after 2015. The current usage metrics is available 48-96 hours after online publication and is updated daily on week days.
Initial download of the metrics may take a while.