Fig. 1.
Download original image
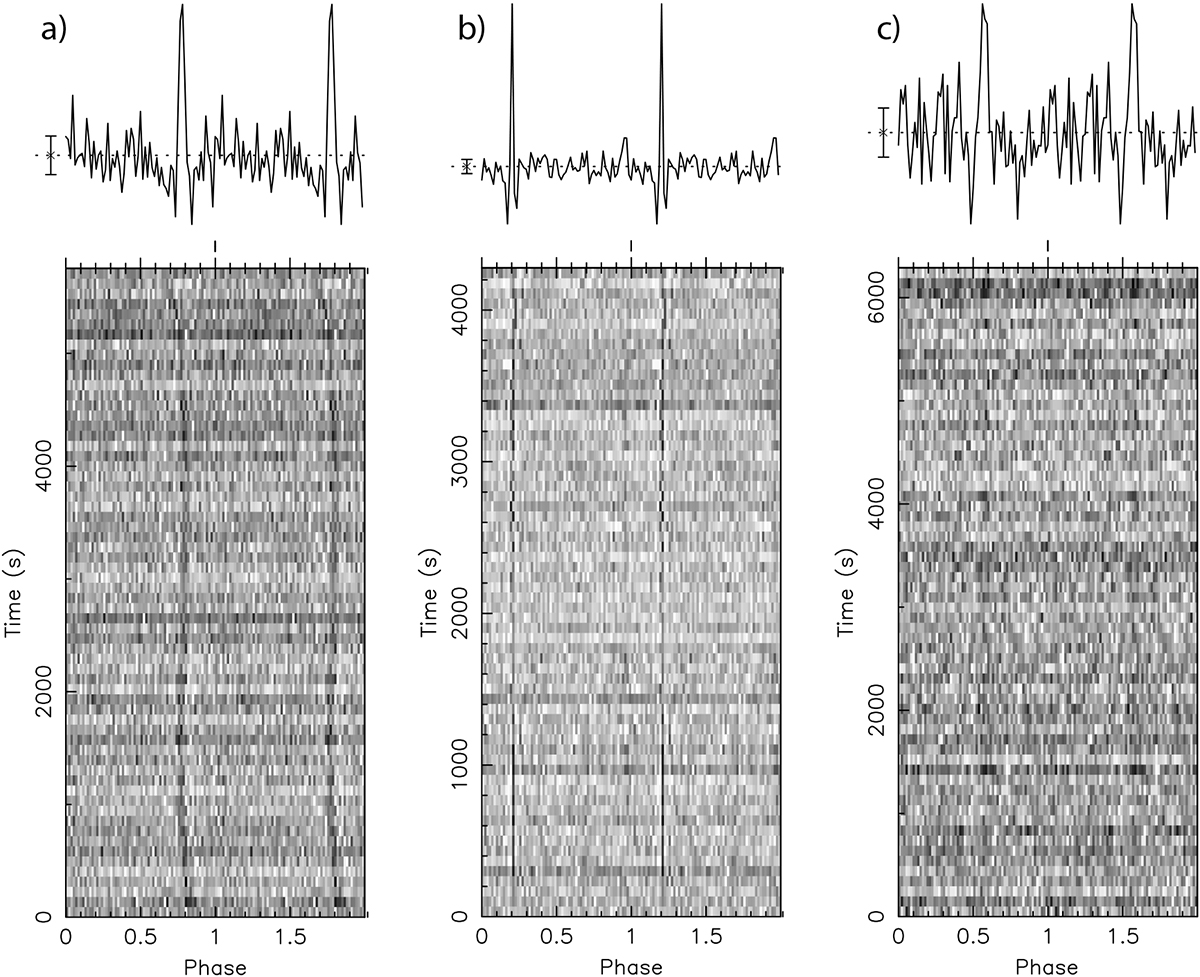
prepfold diagnostic plot. The candidate stands out when it displays a pulsar-like integrated profile (top subpanels; two rotations shown) and a near-constant period when it is demodulated at the orbit of the trial companion (bottom subpanels). Left (a): Candidate with a period of 2.059 s. Middle (b): Candidate with a period of 4.019 s. Right (c): Candidate with a period of 42 ms.
Current usage metrics show cumulative count of Article Views (full-text article views including HTML views, PDF and ePub downloads, according to the available data) and Abstracts Views on Vision4Press platform.
Data correspond to usage on the plateform after 2015. The current usage metrics is available 48-96 hours after online publication and is updated daily on week days.
Initial download of the metrics may take a while.