Open Access
Fig. 3.
Download original image
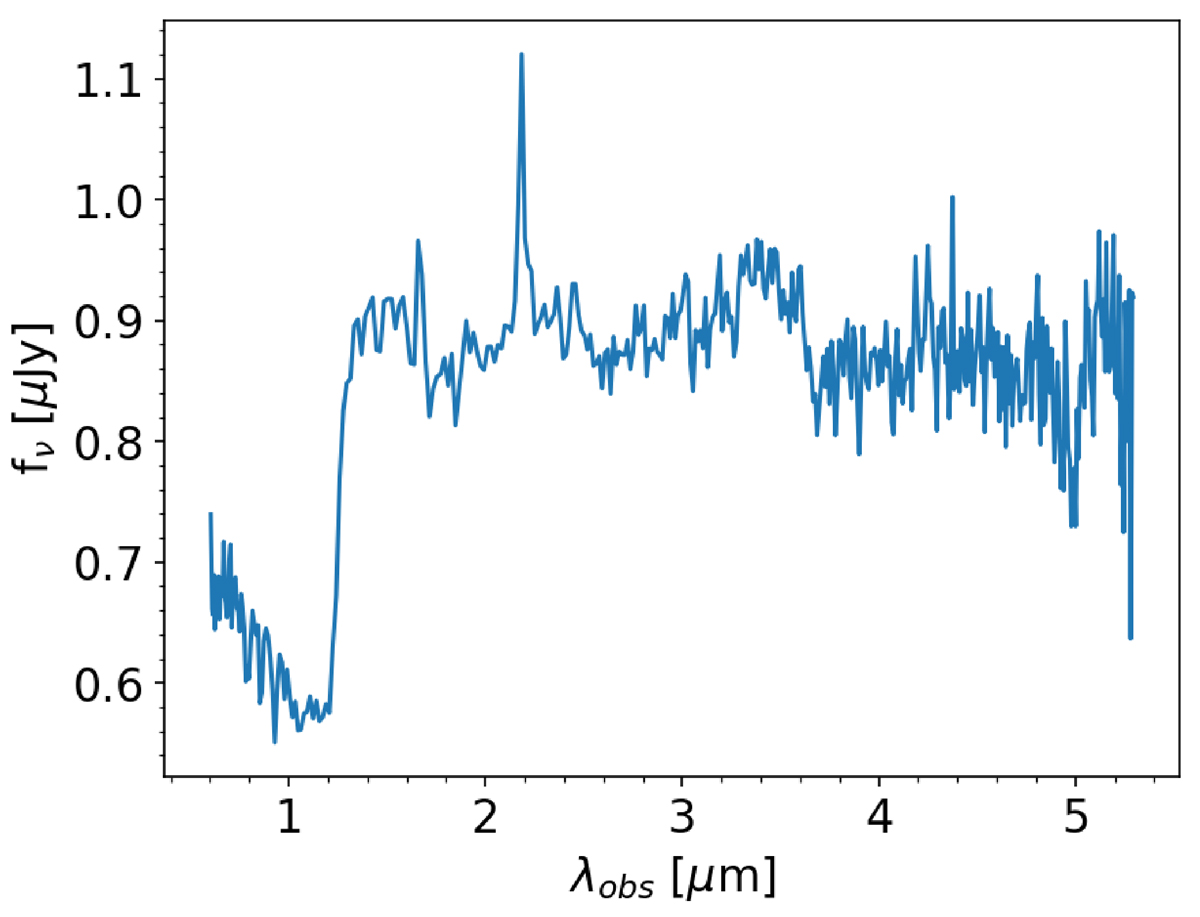
Spectrum from JWST corresponding to the outlier data point, shown in observed wavelengths. The redshifted Hα emission line peak is clearly visible at ∼2.2 μm.
Current usage metrics show cumulative count of Article Views (full-text article views including HTML views, PDF and ePub downloads, according to the available data) and Abstracts Views on Vision4Press platform.
Data correspond to usage on the plateform after 2015. The current usage metrics is available 48-96 hours after online publication and is updated daily on week days.
Initial download of the metrics may take a while.