Fig. 4.
Download original image
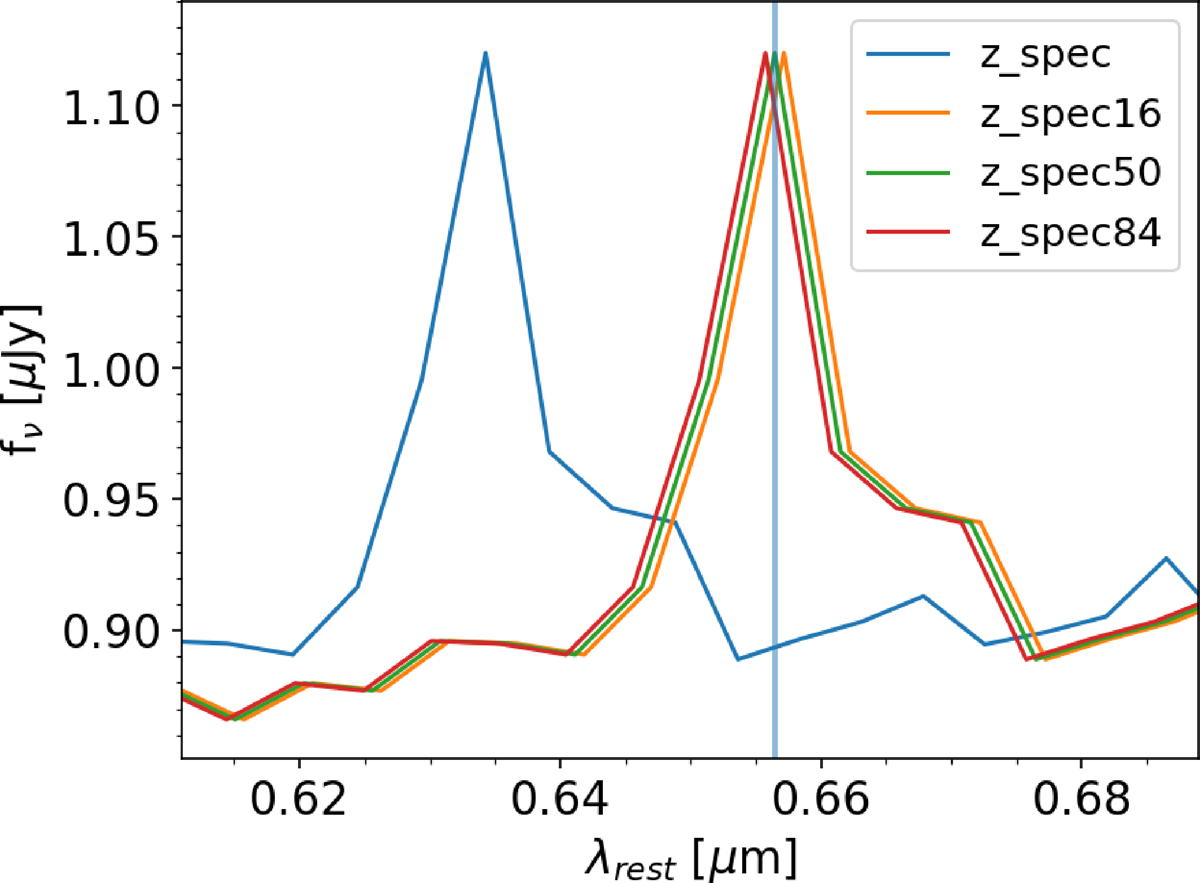
Region around the Hα emission line in the spectrum corresponding to the outlier data point. The observed wavelength (λobs) has been converted to the rest frame (λrest) using different redshift estimates: the blue curve uses z_spec, while the orange, green, and red curves correspond to z_spec16, z_spec50, and z_spec84, respectively. The vertical line marks λrest = 656.46 nm.
Current usage metrics show cumulative count of Article Views (full-text article views including HTML views, PDF and ePub downloads, according to the available data) and Abstracts Views on Vision4Press platform.
Data correspond to usage on the plateform after 2015. The current usage metrics is available 48-96 hours after online publication and is updated daily on week days.
Initial download of the metrics may take a while.