Fig. 10.
Download original image
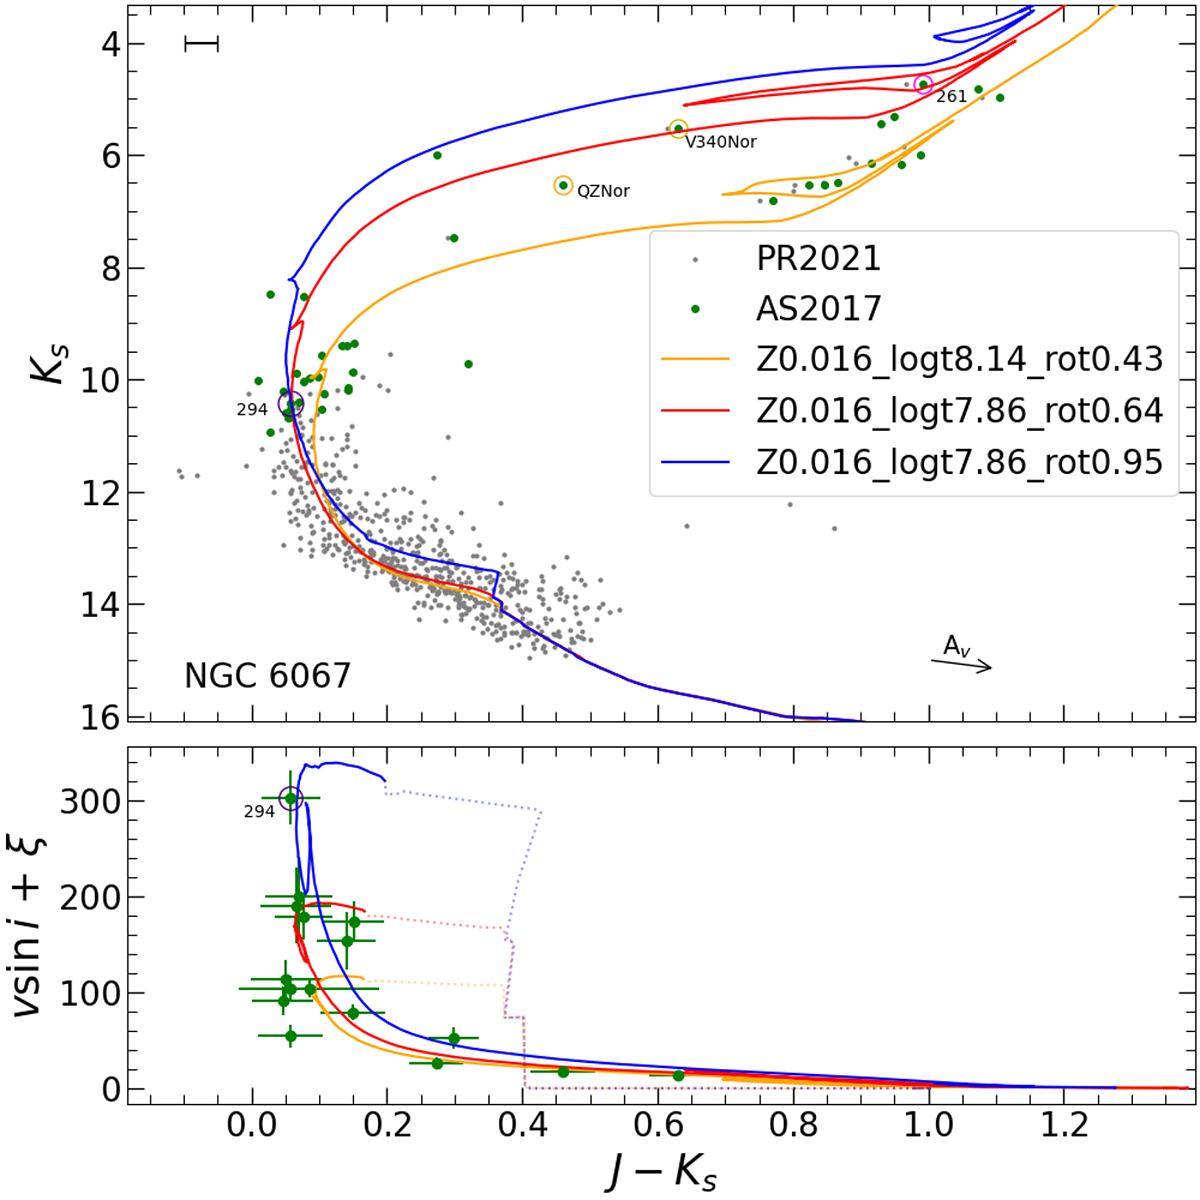
Top panel: CMD of NGC 6067 in Vista photometry. The green dots are data adopted from Alonso-Santiago et al. 2017, and the grey dots are data adopted from Peña Ramírez et al. 2021. The superimposed isochrones are models with the same parameters as in Figs. 8 and 9. Bottom panel: Rotational velocity of stars from the Alonso-Santiago et al. 2017 catalogue, superimposed with the predictions from isochrone models (solid lines show the evolution with KS < 13 mag, and dotted lines show KS > 13 mag). Only stars with precise v sin i and ξ are presented in this plot.
Current usage metrics show cumulative count of Article Views (full-text article views including HTML views, PDF and ePub downloads, according to the available data) and Abstracts Views on Vision4Press platform.
Data correspond to usage on the plateform after 2015. The current usage metrics is available 48-96 hours after online publication and is updated daily on week days.
Initial download of the metrics may take a while.