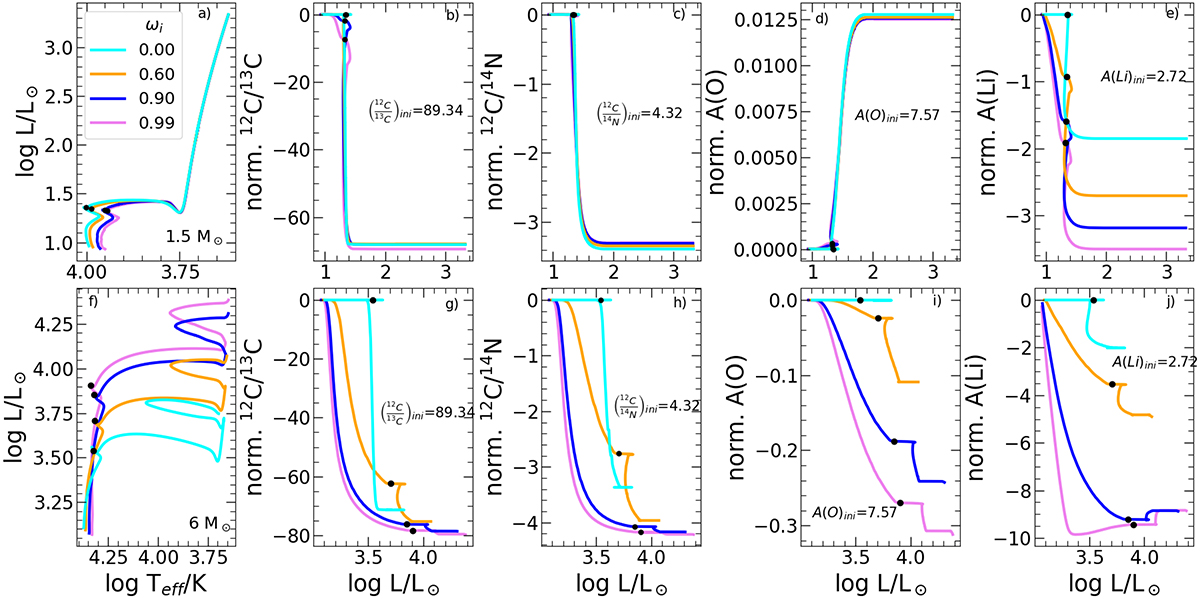
Fig. 3.
Download original image
Impact of rotation on the HRD and several surface abundances normalised to their initial values. Models with a mass of 1.5 M⊙ are shown in the top row (panels a-e), and models with a mass of 6 M⊙ are shown in the second row (panels f-j). Different initial rotation rates are shown by different colours. The first column shows the HRD of the selected models. The second and third columns show the C-isotope ratio and the C/N ratio, respectively, with respect to the initial values. That is, we plot the quantity (X/Y)−(X/Y)ini, where X/Y = nX/nY is number density ratio of species X and Y, and the (X/Y)ini value is specified in the plot. The abundances of 16O and 7Li are shown in the fourth and fifth columns, respectively. In the latter cases, we plot the quantity A(X)−A(X)ini, where A(X) = log(nX/nH)+12 is the abundance of element X, and A(X)ini is its initial value, as specified in each panel. nH is the hydrogen density number. The models are shown from the ZAMS to the RGB tip for the 1.5 M⊙ model, and at the end of the He-burning phase for the 6 M⊙. The black dot marks the TAMS.
Current usage metrics show cumulative count of Article Views (full-text article views including HTML views, PDF and ePub downloads, according to the available data) and Abstracts Views on Vision4Press platform.
Data correspond to usage on the plateform after 2015. The current usage metrics is available 48-96 hours after online publication and is updated daily on week days.
Initial download of the metrics may take a while.