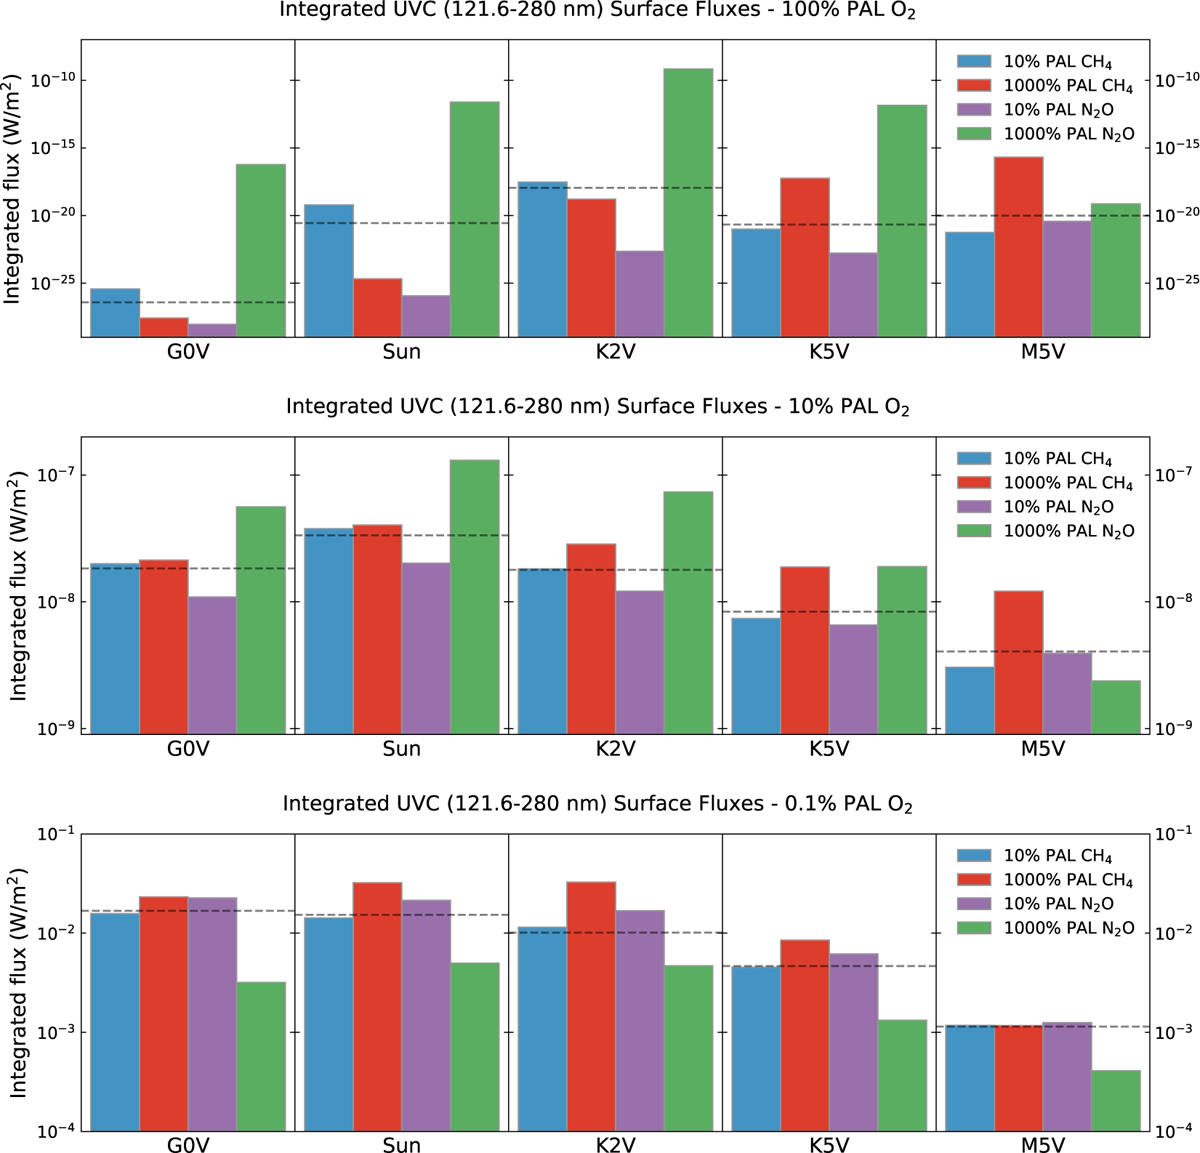
Fig. A.3
Download original image
Comparisons of UVC surface flux for all hosts at 100%, 10% and 0.1% PAL O2, as well as high and low CH4 and N2O variations from this study as well as Kozakis et al. (2025). The dashed horizontal lines indicate the amount of O3 for models with modern levels of both CH4 and N2O. Overall variations in N2O have a stronger impact on UVC surface flux, with larger changes when varying CH4 present primarily at 100% PAL O2.
Current usage metrics show cumulative count of Article Views (full-text article views including HTML views, PDF and ePub downloads, according to the available data) and Abstracts Views on Vision4Press platform.
Data correspond to usage on the plateform after 2015. The current usage metrics is available 48-96 hours after online publication and is updated daily on week days.
Initial download of the metrics may take a while.