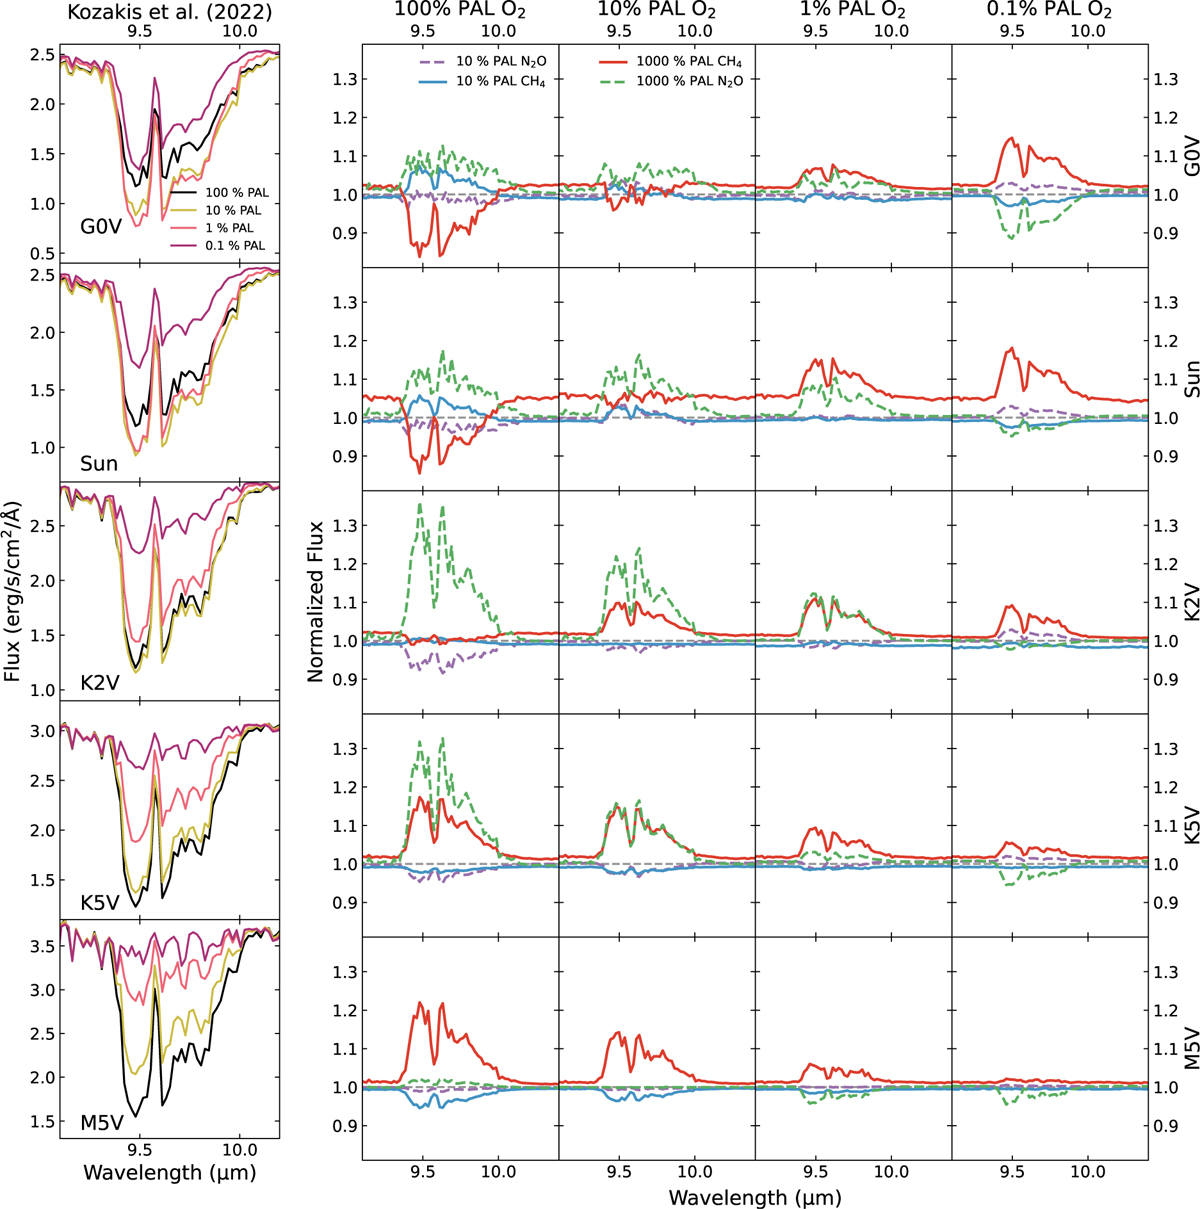
Fig. A.4
Download original image
Comparisons of 9.6 μm O3 emission spectra features from Kozakis et al. (2022) with modern levels of CH4 and N2O (left) and O3 features from varying CH4 and N2O models normalized to modern amounts of CH4 and N2O (right). Y-axis limits for all normalized features are the same to allow for comparison between different O2 levels and host stars. For both variations in CH4 and N2O changes in the O3 feature were primarily due to differences in O3 abundance rather than changes in the atmospheric temperature profiles. The exception being for the CH4 models for the hotter stars at 100% PAL O2, which experienced stratospheric temperature changes depending on the amount of H2O produced from CH4.
Current usage metrics show cumulative count of Article Views (full-text article views including HTML views, PDF and ePub downloads, according to the available data) and Abstracts Views on Vision4Press platform.
Data correspond to usage on the plateform after 2015. The current usage metrics is available 48-96 hours after online publication and is updated daily on week days.
Initial download of the metrics may take a while.