Fig. 4
Download original image
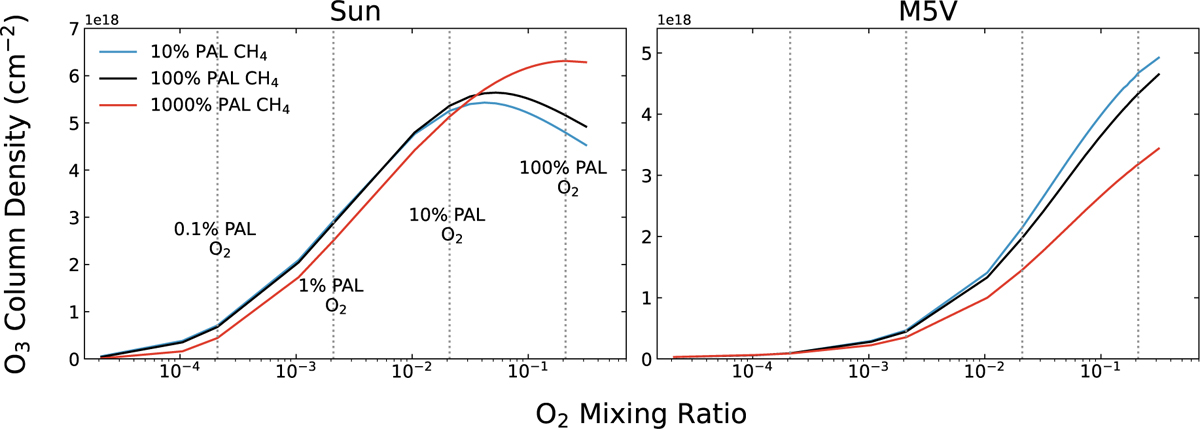
Absolute values of the O2–O3 relationship at all O2 and CH4 levels modeled for planets around the Sun (left) and M5V (right) hosts. O2 levels of 0.1%, 1%, 10%, and 100% PAL are marked with vertical dashed lines to enable easier comparison with Fig. 3. This figure highlights the stark difference in how CH4 impacts the O2–O3 relationship differently for hotter and cooler host stars, due primarily to the amount of UV flux arriving at the planet. For hotter hosts the higher UV flux allows more efficient conversion of CH4 into H2O and then HOx compared to the lower UV flux of M5V host. Full O2–O3 relationships of all hosts including comparisons to Kozakis et al. (2025) are located in Appendix A.
Current usage metrics show cumulative count of Article Views (full-text article views including HTML views, PDF and ePub downloads, according to the available data) and Abstracts Views on Vision4Press platform.
Data correspond to usage on the plateform after 2015. The current usage metrics is available 48-96 hours after online publication and is updated daily on week days.
Initial download of the metrics may take a while.