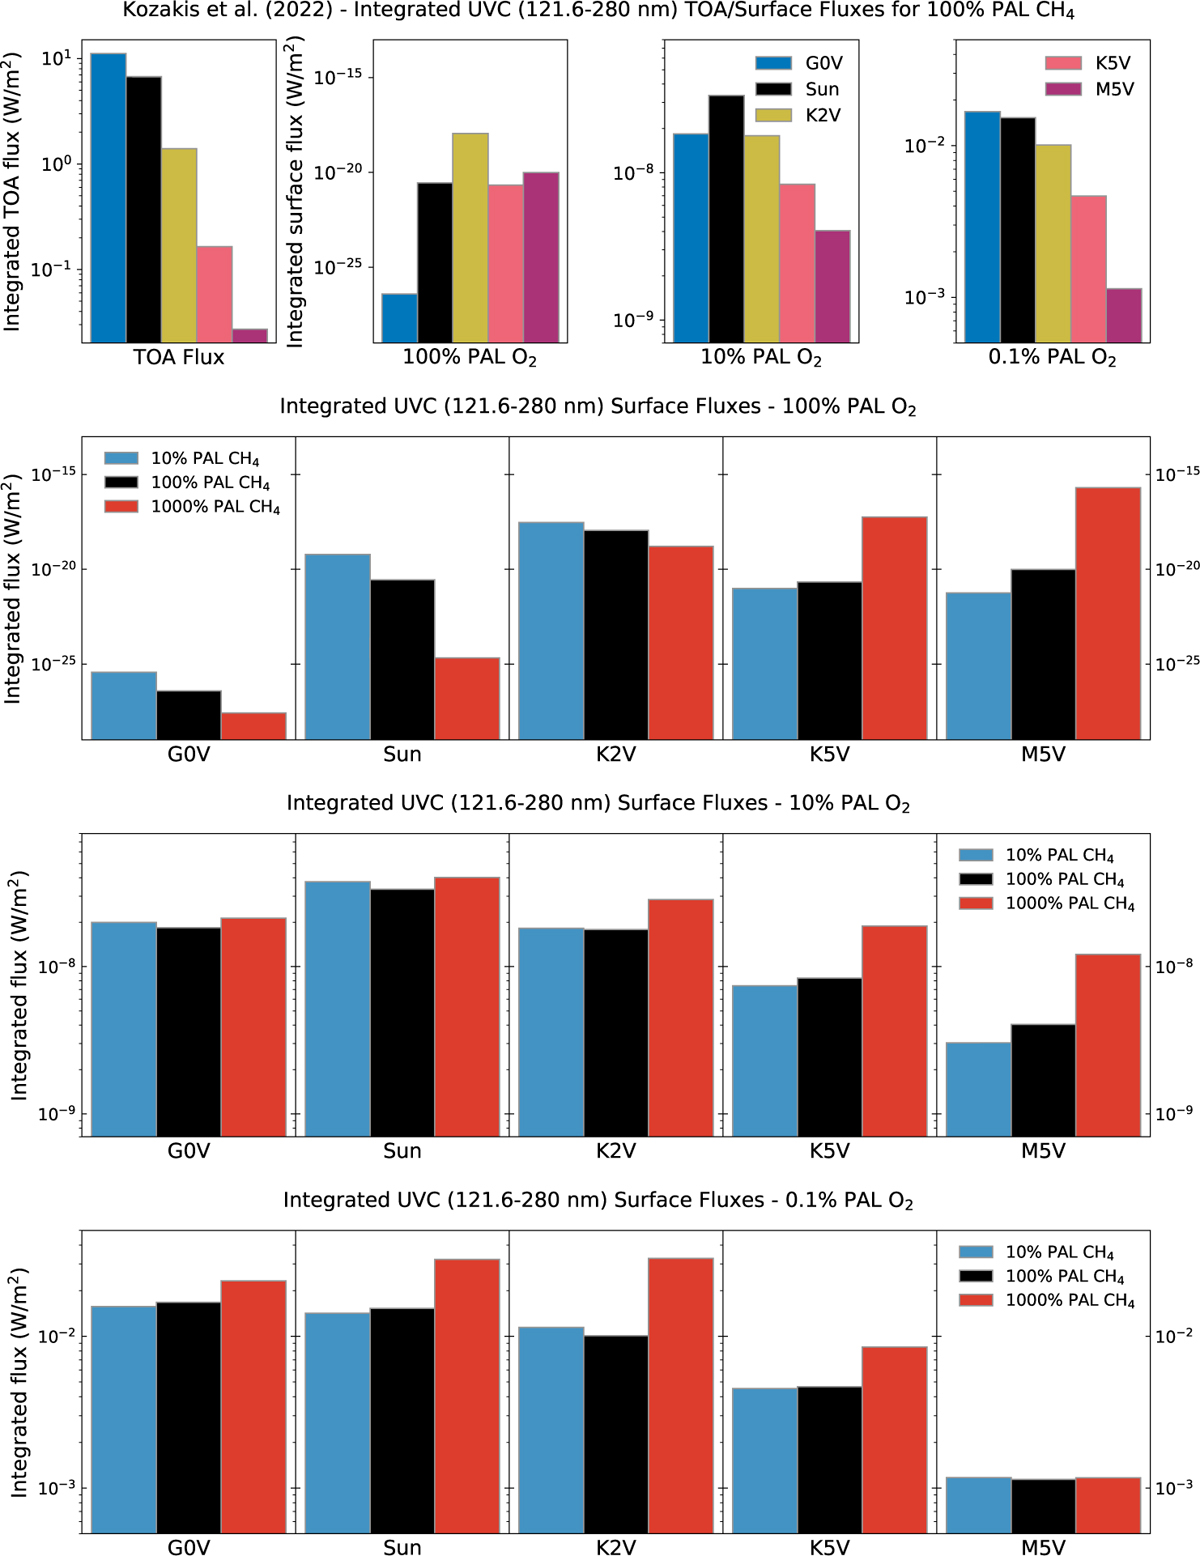
Fig. 7
Download original image
Comparisons of UVC results with modern CH4 abundances (top row) with incident top-of-atmosphere (TOA) UVC flux and surface UVC flux for all hosts with modern levels of CH4 at different O2 levels, and surface UVC flux with varying CH4 for 100% PAL O2 (second row), 10% PAL O2 (third row) and 0.1% PAL O2 (bottom row). Surface UVC plots from Kozakis et al. (2022) use the same y-axis limits as the corresponding plots in the bottom three rows to enable easier comparison. Changes in UVC surface flux are most significant for 100% PAL O2 due to the dependency of oxygen to convert CH4 into H2O and HO2.
Current usage metrics show cumulative count of Article Views (full-text article views including HTML views, PDF and ePub downloads, according to the available data) and Abstracts Views on Vision4Press platform.
Data correspond to usage on the plateform after 2015. The current usage metrics is available 48-96 hours after online publication and is updated daily on week days.
Initial download of the metrics may take a while.