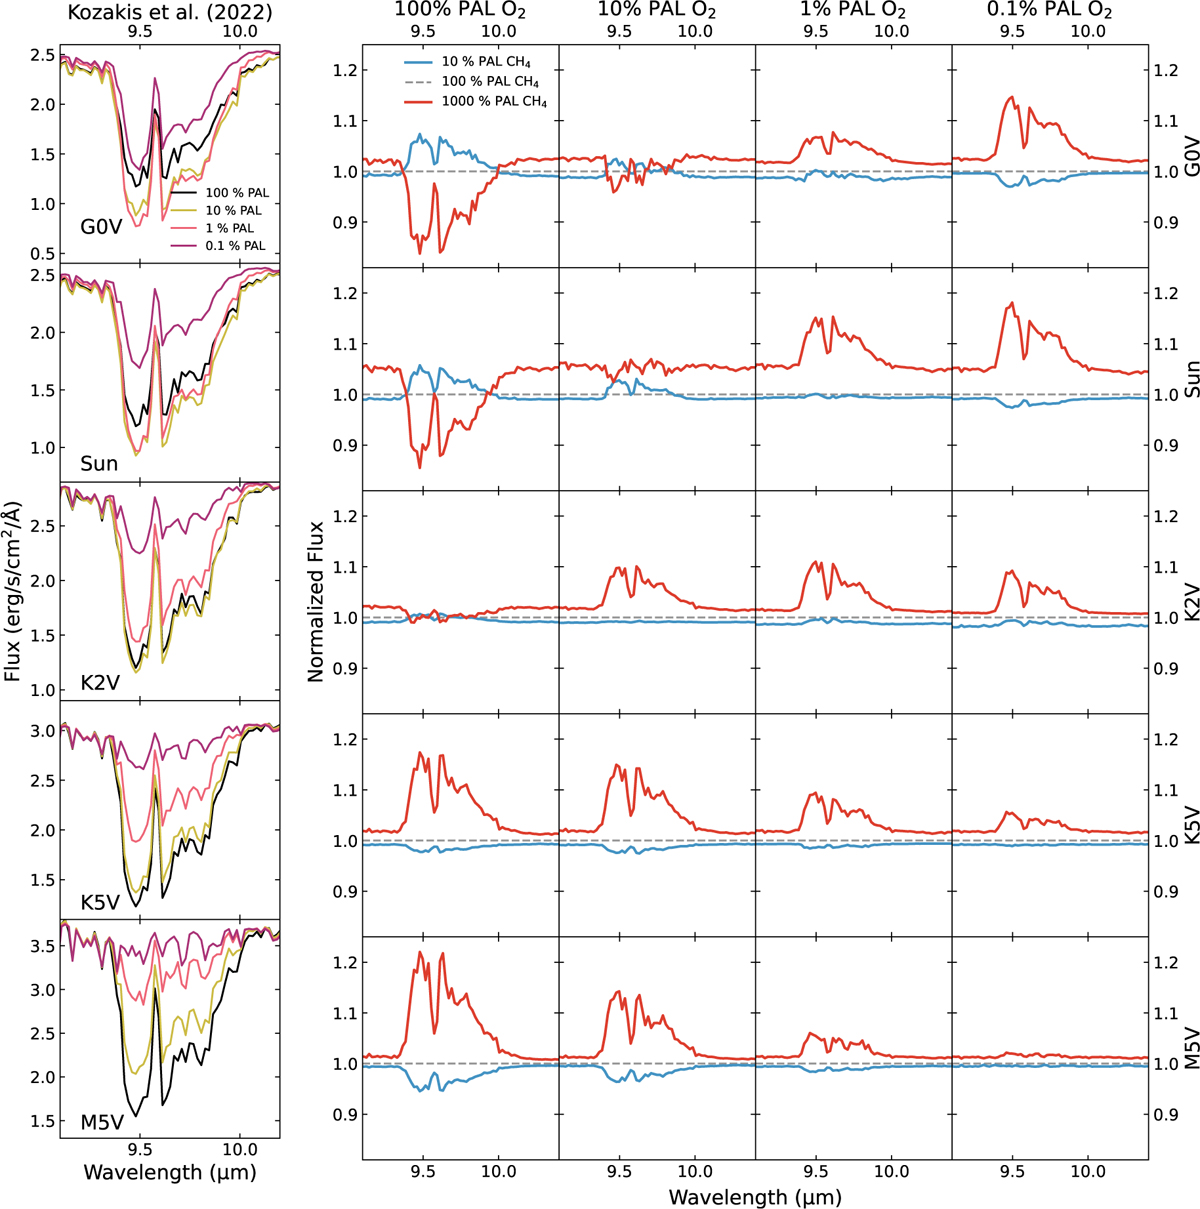
Fig. 8
Download original image
Comparisons of the 9.6 μm O3 emission spectra feature for all hosts at different O2 levels using modern levels of CH4 (left) and O3 features for different CH4 abundances (right) normalized to features with modern levels of CH4. Normalized O3 features use the same y-axis limits for all host stars in order to compare the difference in impact of CH4 on O3 for different hosts. For the hottest hosts at 100% PAL O2 changes in feature strength are due to changes in O3 abundances as well as stratospheric temperatures differences from H2O abundance, while the rest of the model spectra variations are due mainly to changes in O3 due to variations in CH4.
Current usage metrics show cumulative count of Article Views (full-text article views including HTML views, PDF and ePub downloads, according to the available data) and Abstracts Views on Vision4Press platform.
Data correspond to usage on the plateform after 2015. The current usage metrics is available 48-96 hours after online publication and is updated daily on week days.
Initial download of the metrics may take a while.