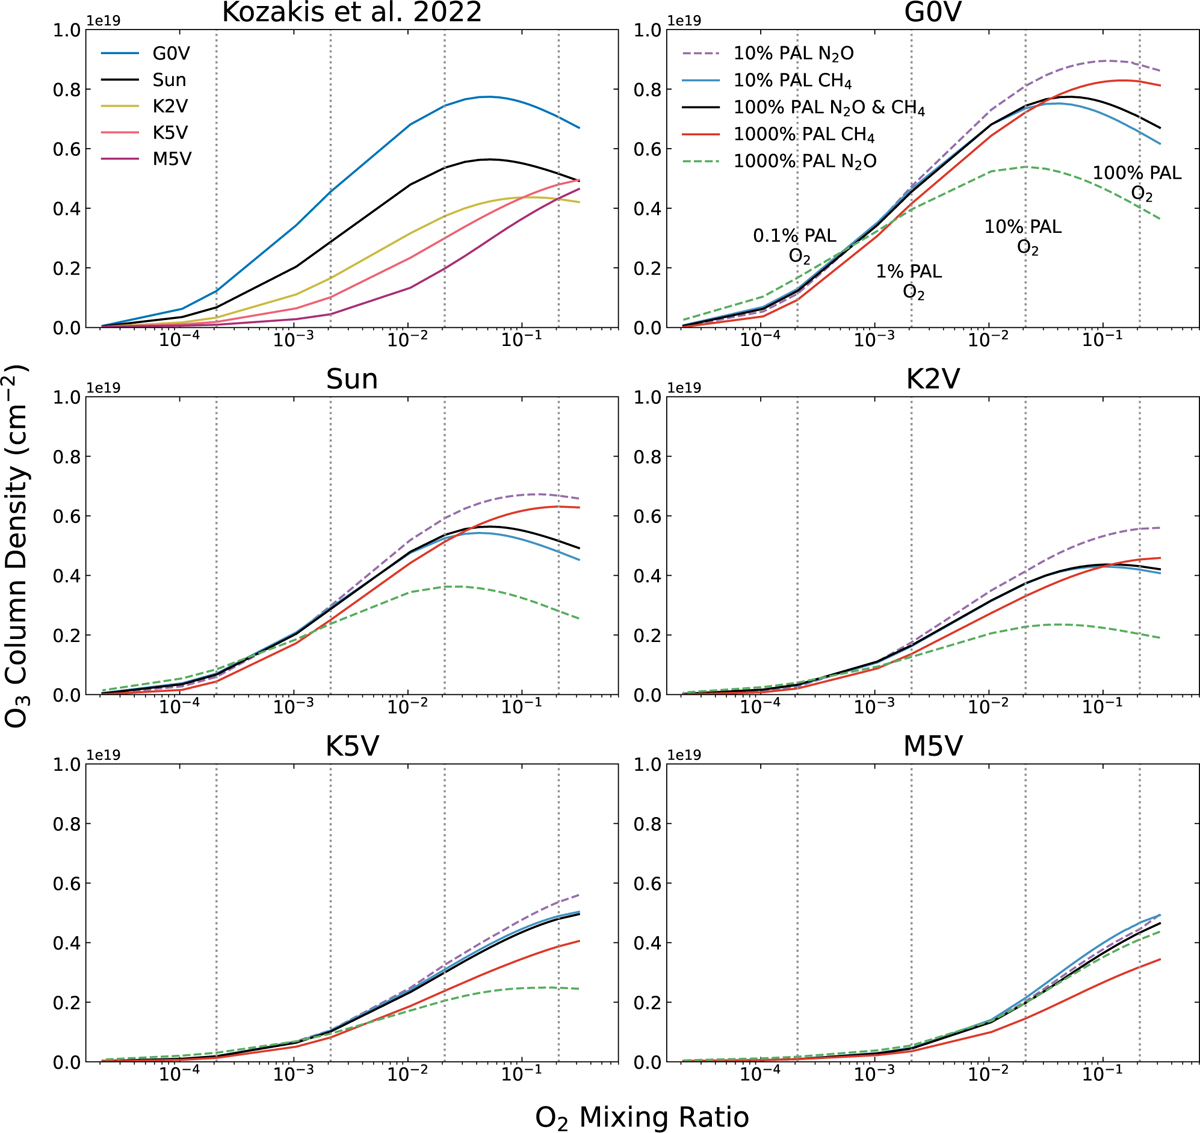
Fig. A.1
Download original image
Relationships of O2–O3 for all host stars at all O2 and CH4 levels modeled, along with comparisons to varying levels of N2O as modeled in Kozakis et al. (2025). All plots share the same y-axis scale to facilitate comparisons. For planets around all hosts except the M5V there are larger variations in O3 when varying N2O rather than CH4. Only the M5V-hosted planet exhibits stronger changes in O3 with CH4 variations.
Current usage metrics show cumulative count of Article Views (full-text article views including HTML views, PDF and ePub downloads, according to the available data) and Abstracts Views on Vision4Press platform.
Data correspond to usage on the plateform after 2015. The current usage metrics is available 48-96 hours after online publication and is updated daily on week days.
Initial download of the metrics may take a while.