Fig. 1
Download original image
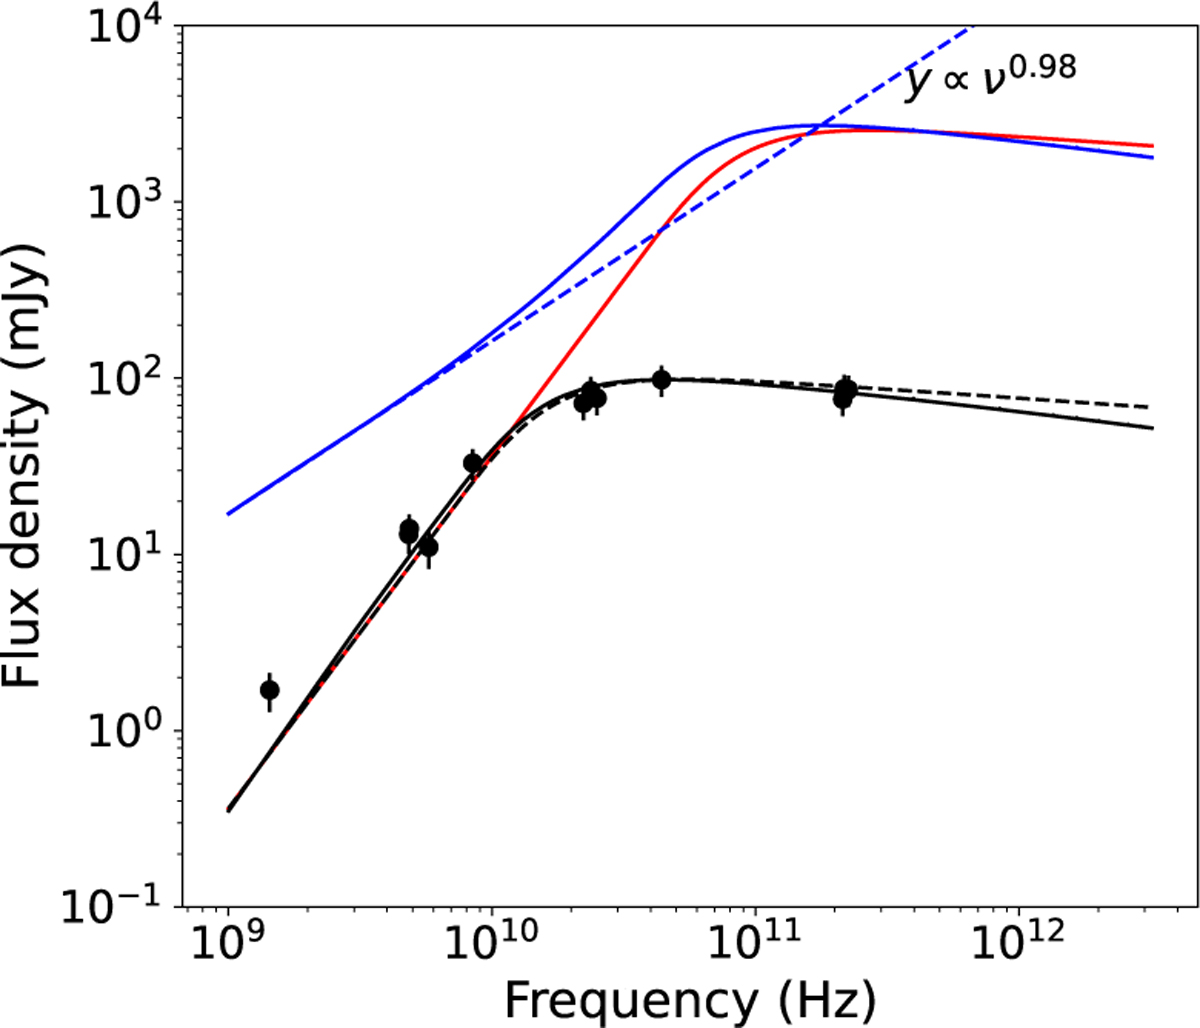
Comparison of the free-free SEDs used as examples. Filled black circles represent data for G24.78+0.08 A1 (Cesaroni et al. 2019). The solid black line is the SED calculated with Cloudy and normalised to the data at 44 GHz. The dashed black line is the theoretical SED with TK = 104K and EM = 1.3 × 10⁹ pc cm−6. The solid blue line is the SED calculated with Cloudy for the second example. The solid red line is a theoretical SED with TK = 104 K and EM = 3.9 × 10¹⁰ pc cm−6.
Current usage metrics show cumulative count of Article Views (full-text article views including HTML views, PDF and ePub downloads, according to the available data) and Abstracts Views on Vision4Press platform.
Data correspond to usage on the plateform after 2015. The current usage metrics is available 48-96 hours after online publication and is updated daily on week days.
Initial download of the metrics may take a while.