| Issue |
A&A
Volume 701, September 2025
|
|
|---|---|---|
| Article Number | A275 | |
| Number of page(s) | 6 | |
| Section | Interstellar and circumstellar matter | |
| DOI | https://doi.org/10.1051/0004-6361/202556038 | |
| Published online | 25 September 2025 | |
Notes on the formaldehyde masers
Centre for Space Research, North-West University,
Potchefstroom
2520,
South Africa
★ Corresponding author: This email address is being protected from spambots. You need JavaScript enabled to view it.
Received:
20
June
2025
Accepted:
12
August
2025
Abstract
Context. The 4.8 GHz formaldehyde masers are rare when compared, for example, to the class II methanol masers, especially when both masers are associated with high-mass star-forming regions. Apart from the rarity of the masers, which has not yet been explained, the non-detection of associated 14.5 GHz masers is also still an outstanding question.
Aims. The first aim of the present work is to investigate, from a theoretical point of view and with more realistic free-free spectral energy distributions (SEDs), whether there are physical conditions in the molecular envelope under which the 110–111 transition is inverted but not the 211–212 transition. The possibility that the non-detection of 14.5 GHz masers is due to the masing region being projected towards the edge of a background hyper-compact H II region is also investigated. Since the 110–111 transition of ortho-H2CO is known to have an anti-inversion behaviour for typical conditions associated with high-mass star-forming regions, it is possible that attenuation affects the 4.8 and 14.5 GHz masers. The second aim is to estimate to what extent attenuation of the 4.8 and 14.5 GHz H2CO masers in the molecular envelope can explain the small number of detected H2CO masers.
Methods. The photo-ionisation code Cloudy was used to calculate more realistic free-free SEDs for a given spectral type of the ionising star and different radial dependences of the initial H I distribution. The free-free SED obtained from the Cloudy simulation was used as the pumping radiation field in the statistical equilibrium calculations.
Results. Using a fit from the Cloudy simulations to the observed free-free SED of the hyper-compact H II region G24.78+0.08 A1, it is found that while the 110–111 transition is weakly inverted, the 211–212 transition is not inverted. In this case, inversion of the 110–111 transition is dominated by collisions and the contribution of the free-free radiation field to the inversion is negligible. Analysis of the dependence of the inversion of the 110–111 and 211–212 transitions on distance into the molecular cloud suggests that there are regions in the circumstellar envelope where the 110–111 transition is inverted but not the 211–212 transition. The optical depths at 4.8 and 14.5 GHz were calculated for three different dependences of the abundance of o-H2CO on depth into the molecular cloud, which shows that significant attenuation of the maser emission is possible.
Conclusions. Not all hyper-compact H II regions have free-free SEDs that are able to produce strong enough 4.8 GHz masers. Attenuation of the 4.8 GHz maser emission in the molecular envelope can be so significant that the 4.8 GHz maser emission is completely absorbed. Detection of the 14.5 GHz maser associated with the 4.8 GHz maser is not a requirement to prove the free-free pumping of the 4.8 GHz masers.
Key words: masers / radiative transfer / ISM: abundances / HII regions / ISM: molecules
© The Authors 2025
 Open Access article, published by EDP Sciences, under the terms of the Creative Commons Attribution License (https://creativecommons.org/licenses/by/4.0), which permits unrestricted use, distribution, and reproduction in any medium, provided the original work is properly cited.
This article is published in open access under the Subscribe to Open model. This email address is being protected from spambots. You need JavaScript enabled to view it. to support open access publication.
1 Introduction
The 4.8 GHz ortho-formaldehyde (henceforth referred to as H2CO) masers are classified as rare, with only 22 individual masers associated with 19 high-mass star-forming regions detected in the Galaxy. The scarcity of these masers is in stark contrast with the significantly larger number of class II methanol, water, and OH masers associated with high-mass star-forming regions. The fact that ortho- and para-H2CO are widely detected in the Galaxy and the use of these molecules as probes of the physical conditions in molecular clouds (see e.g. Downes et al. 1980; Mangum & Wootten 1993; Tang et al. 2018a,b; Brunthaler et al. 2021; Mahmut et al. 2024, and references therein) further highlights the peculiarity of these masers being so rare. To explain the rarity of the H2CO masers, Hoffman et al. (2003) suggested that the inversion of the 110–111 transition is due to a rare collisional excitation and not to excitation by a free-free radiation field as proposed by Boland & de Jong (1981). van der Walt & Mfulwane (2022) and van der Walt (2024) revisited the problem of the pumping of the 4.8 GHz H2CO masers and evaluated the critique raised against the Boland & de Jong (1981) model. van der Walt & Mfulwane (2022) and van der Walt (2024) proposed a pumping scheme that explains the inversion of the 110–111 transition and showed that the 4.8 GHz masers can be pumped collisionally as well as by a free-free radiation field. van der Walt (2024) argued that the radiative pumping via a free-free radiation field will be the dominant mechanism in the environment of young high-mass stars. Still, no clear explanation for the rarity of the masers has been proposed.
Another outstanding question regards the non-detection of 14.5 GHz H2CO masers. Although van der Walt (2024) demonstrated, in support of Boland & de Jong (1981), that a free-free radiation field effectively inverts the 110–111 transition, their results also suggest that the 211–212 transition (14.5 GHz) is typically inverted under similar conditions. However, no 14.5 GHz maser emission associated with known 4.8 GHz masers has yet been detected (Hoffman et al. 2003; Chen et al. 2017; Shuvo et al. 2021). Given that the 4.8 GHz masers are exclusively associated with high-mass star-forming regions (Araya et al. 2015) and that free-free radiation fields can invert both the 110–111 and 211–212 transitions, the non-detection of 14.5 GHz masers requires explanation within the framework of free-free pumping. One proposed explanation is that the 4.8 GHz masers are projected offset from the centre of the H II region, where the 14.5 GHz background brightness temperature is diminished (van der Walt 2024), which will be further addressed in this paper.
The results presented by van der Walt (2024) suggest that the 110–111 and 211–212 transitions are inverted under the same conditions in the nH2-Tk plane. However, closer consideration of this way of presenting the behaviour of these two transitions shows that it is not fully representative of the circumstellar environment, where radial gradients in density, kinetic temperature, the dilution factor, and possibly also the abundance of H2CO exist. Pilot calculations of the inversion of the 110–111 and 211–212 transitions as a function of distance from the outer radius of the H II region showed that there are combinations of nH2, Tk, and dilution factor where only the 110–111 transition is inverted. Representative results will be presented as a possible explanation for the non-detection of the 14.5 GHz masers.
Another factor that may influence the statistics of both the 4.8 and 14.5 GHz masers is the attenuation of these masers by H2CO absorption as the maser emission propagates through the outer parts of the molecular envelope. Estimates of optical depths at 4.8 and 14.5 GHz are presented, from which it follows that attenuation of the maser emission can be significant and may be a contributing factor to the rarity of the 4.8 GHz masers.
2 Numerical calculations
The photo-ionisation code Cloudy (version 23.01; Chatzikos et al. 2023) was utilised to simulate spherical H II regions and compute the emitted free-free spectral energy distribution (SED) integrated over the surface of the H II region. This approach enabled the consideration of free-free SEDs with non-constant electron density and/or electron temperature throughout the ionised gas volume. The H II region was modelled as an ionised shell bounded by an inner radius, ri, and an outer radius, ro (Avalos et al. 2006; Lizano 2008). Temperatures and radii for luminosity class V ionising stars of various spectral types were taken from Sternberg et al. (2003). In realistic H II regions, ri is determined by the balance between the ram pressure of the stellar wind and the thermal pressure at the inner boundary, as well as the evolutionary state of the system. For the present calculations, ri was treated as a free parameter. Except if stated otherwise, the outer radius, ro, was set to 2.61 × 1016 cm, the average radius of 12 hyper-compact H II regions analysed by Yang et al. (2021), consistent with the hyper-compact phase. The radial density of H I is described by
![Mathematical equation: $\[n(r)=n_0\left(r_i\right)\left(1+\frac{\Delta r}{R_s}\right)^{-\alpha} \mathrm{cm}^{-3},\]$](/articles/aa/full_html/2025/09/aa56038-25/aa56038-25-eq1.png) (1)
(1)
where n0(ri) is the density at the inner radius, Δr is the distance into the H II region from ri, and Rs is the scale length. When Rs = ri, the expression simplifies to n(r) = n0(ri)(r/ri)−α. The chemical abundances provided with Cloudy for H II regions were adopted. The details of solving for the level populations from the rate equations are given in van der Walt & Mfulwane (2022) and van der Walt (2024).
3 Results
3.1 Non-inversion of the 211–212 transition
As a first example, Cloudy was used to model the free-free SED of the hyper-compact H II region G24.78+0.08 A1. Cesaroni et al. (2019) modelled the observed SED as originating from a thin shell with an inner radius of 912 AU (1.37 × 1016 cm), an outer radius of 1025 AU (1.54 × 1016 cm), a constant electron density of ne = 6.9 × 105 cm−3, and an O9.5V ionising star. Employing these parameters in a Cloudy simulation, a satisfactory fit to the observed flux density was obtained with ne = 1.6 × 106 cm−3, as depicted by the solid black line in Fig. 1. The SED, computed using Cloudy, was normalised to the observed flux density at 44 GHz. The dashed black line represents the SED for a theoretical H II region with an electron temperature of Te = 104 K and an emission measure of 1.3 × 10⁹ pc cm−6.
Using the Cloudy SED as the pumping radiation field, optical depths τ4.8 and τ14.5 as a function of distance into the molecular cloud were computed, without beaming, adopting nH2 (r) = nH2 (ro)(r/ro)−p and TK(r) = TK(ro)(r/ro)−q with p = 1.5 and q = 0.4 (van der Tak et al. 2000) for two cases: (1) nH2(ro) = 105 cm−3, TK(ro) = 150 K; (2) nH2(ro) = 7 × 105 cm−3, TK(ro) = 300 K. The H2CO abundance was assumed constant at 5.0 × 10⁻⁶. The results for these two cases are presented in Fig. 2. The 110–111 transition is inverted over a smaller radial distance range for case 1 than for case 2, whereas the 211–212 transition remains non-inverted in both cases. The inversion of the 110–111 transition, as depicted in Fig. 2, is, however, dominated by collisional rather than radiative pumping. The solid blue line in Fig. 2 illustrates the variation in τ4.8 for case 2 when the free-free radiation field is absent, indicating a negligible contribution from the radiation field to the inversion of the 110–111 transition. The effect of beaming was found to have minimal impact on τ4.8. For case 2, inversion of the 110–111 transition occurs for 3.5 × 10⁴ < nH2 < 3.2 × 105 cm−3 and 90 < TK < 160 K.
Second, an H II region with an inner radius of ri = 1.58 × 1015 cm and an outer radius of ro = 2.61 × 1016 cm was considered. The initial H I radial distribution is described by Eq. (1), with a density at the inner radius of n0(ri) = 3.16 × 107 cm−3, a scale length of Rs = 3.2 × 1014 cm, and α = 2. These parameters were selected to produce a free-free SED that is flatter than ν2 at frequencies below the turnover frequency. The resulting SED, depicted as the solid blue line in Fig. 1, was scaled using the same normalisation as for G24.78+0.08 A1. The lower-frequency portion of the SED exhibits a ν0.98 dependence, as indicated by the dashed blue line. The solid red line represents the theoretical SED for an H II region with an electron temperature of Te = 104 K and an emission measure of 3.9 × 10¹⁰ pc cm−6. The corresponding variation in τ4.8 and τ14.5 with distance is shown in Fig. 3.
Comparison of Fig. 3 with Fig. 2 shows that the variation in τ4.8 and τ14.5 deviates significantly from the case of collision-dominated inversion. The radial distances at which the 110–111 transition switches from inversion to non-inversion are shifted to larger values, indicating the effect of the radiation field. The important point to note is that, in both cases, a distance interval exists where only the 110–111 transition is inverted. In case 1, the 211–212 transition is not inverted between points a and b, where point a corresponds to R = 1.12 × 1017 cm, nH2 = 1.1 × 104 cm−3, TK = 83 K, and W = 0.014, and point b corresponds to R = 2.9 × 1017 cm, nH2 = 2680 cm−3, TK = 57 K, and W = 0.002.
Figure 4 compares the variation in τ4.8 with and without beaming for case 1, employing Eq. (8) of van der Walt (2024) with α = 5 (not to be confused with α in Eq. (1)). A range of conditions persists where the 110–111 transition is inverted, whilst the 211–212 transition remains non-inverted.
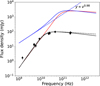 |
Fig. 1 Comparison of the free-free SEDs used as examples. Filled black circles represent data for G24.78+0.08 A1 (Cesaroni et al. 2019). The solid black line is the SED calculated with Cloudy and normalised to the data at 44 GHz. The dashed black line is the theoretical SED with TK = 104K and EM = 1.3 × 10⁹ pc cm−6. The solid blue line is the SED calculated with Cloudy for the second example. The solid red line is a theoretical SED with TK = 104 K and EM = 3.9 × 10¹⁰ pc cm−6. |
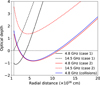 |
Fig. 2 Variation in τ14.8 and τ14.5 as a function of radial distance from the ionising star when the Cloudy SED for the hyper-compact H II region G24.78+0.08 A1 is used. The vertical dashed line represents the outer radius of the H II region. For case 1, nH2 (ro) = 105 cm−3 and TK(ro) = 150 K. For case 2, nH2 (ro) = 7 × 105 cm−3 and TK(ro) = 300 K. |
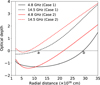 |
Fig. 3 Variation in τ14.8 and τ14.5 as a function of radial distance from the ionising star when the Cloudy SED for the second example (blue line in Fig. 1) is used. Cases 1 and 2 correspond to those used in Fig. 2. |
3.2 Masers are projected offset from the centre of the H II region
To account for the non-detection of 14.5 GHz masers, van der Walt (2024) proposed that the masing region is projected towards the edge of a hyper-compact H II region, where the 14.5 GHz brightness temperature is diminished. Among the known 4.8 GHz maser sources, it is only NGC 7538 IRS1 for which high-resolution C and U-band maps as well as accurate positions of the 4.8 GHz masers could be found to test the proposal of van der Walt (2024). Considering Fig. 2 of Sandell et al. (2009) and the coordinates for the 4.8 GHz masers given by Hoffman et al. (2003), it is found that the offset in right ascension between the masers and the reference position is −0.42 arc-seconds and −0.064 arc-seconds in declination. Inspection of Fig. 2 of Sandell et al. (2009) shows that, while there is 4.8 GHz background emission at the position of the masers, there is either very weak or no background continuum emission at 14.96 GHz at the same position. Further inspection of the 1.2 cm brightness temperature map of NGC 7538 IRS1 presented by Beuther et al. (2017) shows a definite absence of 1.2 cm emission at the position of the 4.8 GHz masers, in agreement with the K-band image in Fig. 2 of Sandell et al. (2009).
Although an accurate position of the 4.8 GHz maser in G32.7441-0.0755 is not available, the high-resolution 5 GHz map from the CORNISH survey (Hoare et al. 2012; Purcell et al. 2013) could be used to assess the variation in free-free brightness temperature with projected radial distance from the emission centre. The free-free emission exhibits asymmetry, with elongation towards the north. The east-west extent of the free-free emission, derived from the CORNISH survey image, is approximately 1.29 arc-seconds. Based on a local standard of rest velocity (Vlsr) of 36.4 km s−1, the near- and far kinematic distances are calculated as 2.36 and 11.73 kpc, respectively. At the far kinematic distance, this corresponds to a linear dimension of 0.74 pc, which exceeds the typical size of a hyper-compact H II region. Consequently, the near kinematic distance was adopted. Figure 5 presents the brightness temperature as a function of projected radial distance, which shows a pronounced decrease with increasing radial distance from the centre. From the X-band image of G32.7441-0.0755 (Yang et al. 2021), an angular diameter of approximately 0.744 arc-seconds is found, corresponding to a projected radial distance to the edge of the X-band emission of approximately 1.3 × 1016 cm, as indicated by the vertical dash-dot line in Fig. 5. Consequently, a 14.5 GHz maser would likely exhibit negligible or no emission if the 4.8 GHz maser is projected against the H II region beyond the edge of the X-band emission.
Figure 6 shows an example of the projected radial variation in the continuum brightness temperatures at 4.8, 14.5, and 28.9 GHz calculated from the output of the Cloudy simulation, for which the free-free SED is the solid blue line in Fig. 1. It is seen that the brightness temperature at 4.8 GHz is approximately an order of magnitude greater than at 14.5 GHz at distances around 1.5 × 1016 cm. If, for example, in the case of G32.7441-0.0755 the masing column is projected against the H II region at a distance of ~2 × 1016 cm from the centre, the background brightness temperature at 4.8 GHz is ~60 K. Assuming then, from Fig. 6, that the background brightness temperature at 14.5 GHz is 6 K, τ14.5 = −1 and τ4.8 = −4.64 (from Fig. 4), the brightness temperature of the 4.8 GHz maser is 6212 and 16.3 K for the 14.5 GHz maser. To what extent this scenario can explain the non-detection of the 14.5 GHz masers, at least for some of the known 4.8 GHz maser sources, can only be evaluated with the aid of high-resolution mapping of the background continuum emission at 4.8 and 14.5 GHz, as well as having accurate positions of the 4.8 GHz masers, which is currently not available for most of the 4.8 GHz masers.
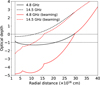 |
Fig. 4 Variation in τ14.8 as a function of radial distance from the ionising star when the Cloudy SED for the second example (blue line in Fig. 1) is used and when beaming is included. |
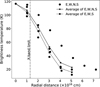 |
Fig. 5 Variation in the free-free brightness temperature for G32.7441-0.0755 as derived from the publicly available CORNISH data. The vertical line represents the outer edge of the X-band emission estimated from the image in Yang et al. (2021). |
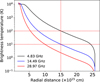 |
Fig. 6 Radial distance dependence of the free-free brightness temperature at 4.8, 14.5, and 28.9 GHz for the second example presented in Sect. 3.1. |
3.3 Attenuation of the 4.8 and 14.5 GHz maser emission
Observations by Okoh et al. (2014) using the Nanshan 25 m telescope indicate a significant detection rate of H2CO 4.8 GHz absorption towards high-mass star-forming regions associated with 6.7 GHz CH3OH masers. Five H2CO maser sources – G23.01-0.41, G23.71-0.20, G24.33+0.13, G25.83-0.18, and G37.55+0.20 – are included in the sample and exhibit associated 4.8 GHz absorption features. At 4.8 GHz, the beam size of the Nanshan 25-m telescope is 10 arc-minutes, corresponding to a diameter of 8.7 pc at a distance of 3 kpc. Although this exceeds the scale of hyper-compact and ultra-compact H II regions, it underscores the necessity of considering attenuation of H2CO 4.8 and 14.5 GHz maser emission within the circumstellar envelope.
The optical depth at the line centre along a ray path through the molecular envelope is expressed, in terms of the level populations, as
![Mathematical equation: $\[\tau_\nu=\frac{1}{8 \pi}\left(\frac{c}{\nu}\right)^3 \frac{1}{\Delta v} \frac{g_u}{g_{\ell}} A_{u \ell} \int_{r_{\min }}^{r_{\max }} n_{\ell}(r)\left[1-\frac{g_{\ell} n_u(r)}{g_u n_{\ell}(r)}\right] \mathrm{d} r\]$](/articles/aa/full_html/2025/09/aa56038-25/aa56038-25-eq2.png) (2)
(2)
or, in terms of the excitation temperature for the transition, as
![Mathematical equation: $\[\tau_\nu=\frac{1}{8 \pi}\left(\frac{c}{\nu}\right)^3 \frac{1}{\Delta v} \frac{g_u}{g_{\ell}} A_{u \ell} \int_{r_{\min }}^{r_{\max }} n_{\ell}(r)\left[1-\exp \left(\frac{-h v}{k T_{e x}(r)}\right)\right] \mathrm{d} r,\]$](/articles/aa/full_html/2025/09/aa56038-25/aa56038-25-eq3.png) (3)
(3)
where all symbols have their normal meaning and a constant velocity width, Δv, has been assumed.
Due to the overpopulation of the lower doublet states relative to local thermodynamic equilibrium under specific conditions (Townes & Cheung 1969; Evans et al. 1975; Troscompt et al. 2009), optical depths cannot be estimated assuming local thermodynamic equilibrium level populations, as performed, for instance, by van der Walt et al. (2021) for CS. Theoretical estimates of the optical depths must therefore be made by solving for the level populations from the rate equations without a free-free radiation field and assuming radial dependences for nH2, kinetic temperature, Tk, and the H2CO abundance, XH2CO. For the following calculations nH2 (r) = nH2 (rmin)(r/rmin)−1.5 and TK(r) = TK(rmin)(r/rmin)−0.4 (van der Tak et al. 2000; Gieser et al. 2021) were used with nH2 (rmin) = 3 × 105 cm−3 and TK(rmin) = 100 K. The inner radius was set to rmin = 2.9 × 1017 cm, where inversion of the 110–111 transition ceases in Figs. 3 and 4. The outer radius was set to rmax = 1 parsec.
Level populations were computed as a function of radial distance in intervals of 5 × 1015 cm for three cases of XH2CO(r), with XH2CO(rmin) = 10−6 based on Nomura & Millar (2004). In the first case, XH2CO(r) ∝ r−γ was assumed, with XH2CO(rmax) = 10−9, implying γ = 2.9. The cumulative optical depths and excitation temperatures at 4.8 and 14.5 GHz as a function of radial distance are presented in Fig. 7. The excitation temperatures decrease rapidly, falling below 2.73 K. The cumulative optical depth increases with distance into the envelope and stabilises as nH2 and XH2CO decrease. At 1 parsec, the optical depths are τ4.8 = 9.5 and τ14.5 = 9.9. Thus, for a maser for which, say, τ4.8 ~ −9 and which is projected against a free-free radiation field with a brightness temperature of Tb = 100 K, the unattenuated brightness temperature is approximately 8 × 10⁵ K. With attenuation in the circumstellar envelope, the brightness temperature is reduced to approximately 60 K.
In a second case, the radial abundance profile of H2CO from Fig. 4b of Nomura & Millar (2004) was used, where XH2CO = 10−6 up to approximately 0.3 pc, followed by a sharp decline to 10−9. The cumulative optical depths exhibit a behaviour similar to that in Fig. 7, with τ4.8 and τ14.5 reaching maximum values of approximately 29 and 32, respectively. Under these conditions, 4.8 and 14.5 GHz maser emission would be entirely absorbed in the envelope. Nomura & Millar (2004) also consider a scenario where mantle molecules are trapped in water ice, therefore evaporating at smaller radial distances. In this case, XH2CO decreases sharply from 10−6 to 10−9 at approximately 0.09 pc (see their Fig. 5b). Due to this rapid decrease in XH2CO near rmin, the optical depths are τ4.8 ≈ 0.16 and τ14.5 ≈ 0.1 at 1 parsec, which means that the maser radiation can escape unattenuated.
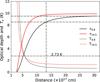 |
Fig. 7 Cumulative optical depth and excitation temperatures as a function of distance at 4.8 and 14.5 GHz. |
4 Discussion and conclusions
As stated in the Introduction, the reasons behind the rarity of the H2CO masers remain unknown. The result that the free-free SED for G24.78+0.08 A1 is ineffective in inverting the 110–111 transition is important in the context of the rarity of the 4.8 GHz H2CO masers. If a significant number of young high-mass star-forming regions have free-free SEDs similar to that of G24.78+0.08 A1, it follows that, most likely, none of these will have associated 4.8 GHz masers. Thus, part of the answer as to why the 4.8 GHz H2CO masers are rare may therefore be that the free-free radiation fields of some high-mass star-forming regions are not effective to invert the 110–111 transition. A comparison of the free-free SEDs of high-mass star-forming regions with and without 4.8 GHz masers may be helpful in this regard.
Although free-free SEDs similar to that of G24.78+0.08 A1 may not suffice to invert the 110–111 transition, collisional inversion may still be possible, as suggested in Fig. 1 and discussed by van der Walt & Mfulwane (2022). However, for purely collisional pumping, τ4.8 is typically less than 1 and, as noted above, beaming does not have a significant effect on the inversion. It is therefore expected that, considering the possibility of attenuation in the outer regions of the circumstellar envelope, collisional inversion will give rise to weak masers that might not be detected.
The results shown in Figs. 3 and 4 are significant since they suggest the possibility that there are regions in the circumstellar envelope where only the 110–111 transition is inverted. Detection of 14.5 GHz masers associated with the 4.8 GHz masers is therefore not a necessary condition for the radiative pumping by a free-free radiation field. However, the non-detection of a 14.5 GHz maser does not imply that the 4.8 GHz maser is excited in a region where the 211–212 transition is not inverted. It is still possible that τ14.5 is small and the masing region is projected against some part of the H II region where the 14.5 GHz background free-free emission is weak, or absent, as discussed in Sect. 3.2.
Considering the results in Sect. 3.3, the question is to what degree the 4.8 GHz (and perhaps the 14.5 GHz) H2CO masers are attenuated in the molecular envelope. Gong et al. (2023) present maps of τ4.8 for Cygnus X, which show that τ4.8 is ≲0.5 for extended cloud structures that are well resolved at an angular resolution of 10′.8. It can be assumed that similar extended regions of H2CO absorption are associated with high-mass starforming regions in general. However, attenuation for τ4.8 ≲ 0.5 is not enough to affect the maser emission significantly.
Although the excitation temperatures are plotted against distance in Fig. 7, the graph implicitly reflects how the excitation temperatures vary with density and temperature. The excitation temperatures drop below 2.73 K at nH2 ~ 1.08 × 105 cm−3 and Tk~76 K and stay below 2.73 K up to 1 parsec, where nH2 ~8.6 × 103 cm−3 and Tk~38 K. This range of densities and kinetic temperatures fall within the range of densities and kinetic temperatures derived for high-mass star-forming regions (see e.g. van der Tak et al. 2000; McCauley et al. 2011; Ginsburg et al. 2011). The implication is that a significant fraction of H2CO molecules might be in 111 over a large part of the ‘inner’ envelope, and that some degree of attenuation of maser emission propagating through the envelope is therefore inevitable.
Further evidence that the optical depths as shown in Fig. 7 are not unrealistic is found in Gieser et al. (2021), who derived an average H2CO column density of ~4 × 1015 cm−2 for 18 high-mass star-forming regions. Assuming an excitation temperature of 1.5 K for the 110–111 transition and Δv = 5 km s−1 in Eq. (3), one finds that τ = 6.89 × 10⁻¹⁴Nℓ, where Nℓ is the column density of molecules in 111. Using an ortho-to-para ratio of 3:1 and assuming that 50% of the molecules are in 111, giving Nℓ = 1.5 × 1015 cm−2, an optical depth of 14.6 is found. A more relevant example is that of NGC 7538 IRS1, where Feng et al. (2016) estimated a H2CO column density of approximately 1017 cm−2 close to the position of the 4.8 GHz H2CO maser. If the excitation temperature of the 110–111 transition is ≈1.5 K for only 10% of the total column density of o-H2CO, an optical depth of ~25 is found. It is also to be noted that the p-H2CO lines at 218.33 GHz (303–202), 218.475 GHz (322–221), and 218.76 GHz (321–220), as well as the C18O(2 − 1) (219.56 GHz) and 13CO(2 − 1) (220.398 GHz) lines, are in absorption against the background free-free emission, signifying the presence of dense gas in front of the 1.37 mm continuum source. Goddi et al. (2015) independently concluded that NGC 7538 IRS1 is the densest known hot core, with the implication that the location of the masing H2CO region must be such that the ‘outward’ propagating maser emission can escape with minimum attenuation. It might therefore be that the 22 known 4.8 GHz H2CO masers are indicative of a special or rare geometry that allows the maser emission to escape with minimum attenuation.
In this regard, it is worth noting the following: of the 22 known 4.8 GHz masers, only in the case of Sgr B2N A does the maser line lie in an absorption feature (Mehringer et al. 1994). Other maser sources for which an absorption feature is present in the maser spectrum (depending on the angular resolution or the angular size of the region of integration) are Sgr B2N C, Sgr B2S H (Mehringer et al. 1994, VLA-CnB), G29.96-0.02 (Hoffman et al. 2003, VLA-CnB), G25.83-0.18 (Araya et al. 2008, VLA-BnA, VLA-D), G32.74-0.07 (Araya et al. 2015, Arecibo), IRAS 18566+0408, NGC 7538 IRS1 (Araya et al. 2007, GBT), and G339.88-1.26 (Chen et al. 2017, TMRT). In these cases, the 4.8 GHz maser lines lie at the edge of the absorption feature. The velocities of the absorption features were found to coincide with the systemic velocities for those sources for which the systemic velocities could be found. The maser lines are typically offset from the systemic velocity by a few km s−1. No absorption features in the maser spectra have been reported for Sgr B2 B, Sgr B2S D, Sgr B2 E, Sgr B2N F, Sgr B2S G, Sgr B2 I (Mehringer et al. 1994, VLA-CnB), G0.38+0.04 (Ginsburg et al. 2015, ATCA), G23.71-0.20 (Araya et al. 2006, VLA-A), G23.01-0.41 (Araya et al. 2008, VLA-BnA, VLA-D), or G24.33+0.13 (McCarthy et al. 2022, ATCA). The absorption features referred to above are most likely against the cosmic microwave background (see e.g. Araya et al. 2015).
It is remarkable that for several high-mass star-forming regions, the 4.8 GHz maser spectra have the same characteristic, i.e. the maser emission lies at the edge of an absorption feature and is therefore offset from the systemic velocity. In none of the cases where a 4.8 GHz maser line lies at the edge of an absorption feature is there an indication of maser emission in the velocity range covered by the absorption feature. Using the centre velocity, vabs, and the standard deviation, σabs, of the absorption features listed by Okoh et al. (2014) and the published velocities for the 4.8 GHz H2CO masers in G23.01-0.41, G24.33+0.13, and G25.83-0.18, the velocity offset relative to the velocity dispersion, |vmaser − vabs|/σabs, for these sources is respectively 0.62, 1.47, and 2.08. For G339.88-1.26, a value of 2.34 is found for the maser feature nearest to the absorption feature and 3.77 for the strongest 4.8 GHz maser feature using the results presented by Chen et al. (2017); for G29.96-0.20, a value of 1.54 using the results of Hoffman et al. (2003); and for G37.55+0.20 a value of 3.11 using the results of Araya et al. (2004). Apart from G23.01-0.41, the maser velocity is offset from the centre velocity of the 4.8 GHz absorption by more than one standard deviation of the velocity dispersion.
A possible explanation for the observed offsets is that the H2CO masers originate in a kinematic structure that Dopplershifts the maser emission to velocities where the τ4.8 in the envelope is sufficiently small, thereby allowing the maser emission to escape. In this regard, it is noted that the observations of Beltrán et al. (2011, see their Fig. 7) suggest the presence of a rotating toroid in G29.96-0.02 with the most redshifted emission at 100 km s−1. Components I and II of the 4.8 GHz masers in G29.96-0.02 have velocities respectively of 100.24 and 102.0 km s−1. This suggests that the two maser components are physically associated with the rotating toroidal structure, which can explain the offset of the maser velocity from the systemic velocity.
As a last remark, it is noted that the results presented above do not apply to the extragalactic formaldehyde masers. Whereas the Galactic H2CO masers are associated with individual high-mass star-forming regions, the extragalactic H2CO masers in IC 860, IRAS 15107+0724, and Arp 220 seem to arise from a central molecular structure of size 30–100 pc centred on the nuclei of these galaxies as well as from some isolated star-forming regions (Baan et al. 2017). The analysis and interpretation of integrated maser emission over such large regions, which include many star-forming regions, falls outside the scope of this paper. The same applies to the single dish 110–111 and 211–212 absorption spectra of starburst galaxies presented by Mangum et al. (2013).
Based on the above-presented results, it is concluded that:
Not all free-free SEDs associated with hyper-compact H II regions are effective in inverting the 110–111 transition. This may partially explain the small number of detected 4.8 GHz H2CO masers.
The non-detection of the 14.5 GHz maser may partly be due to the masing region being projected against a region with very weak or no 14.5 GHz emission.
The numerical calculations suggest that there might be regions in the circumstellar environment where the 110–111 transition is inverted, but not the 211–212 transition. The non-detection of the 14.5 GHz H2CO maser may be partly due to the inversion of the 110–111 transition occurring under conditions where the 211–212 transition is not inverted.
Attenuation of 4.8 GHz maser emission at velocities close to the centre velocity of H2CO in the envelope can be significant and can even lead to the complete absorption of the maser emission, which can result in the non-detection of 4.8 GHz masers. For at least six high-mass star-forming regions, the maser velocities are offset from the systemic velocity, which might result in a reduced attenuation of the masers.
The small number of H2CO masers in the Galaxy may be due to the combined effect of some free-free SEDs not being effective to invert the 110–111 transition, attenuation of the maser emission in the molecular envelope, the chemistry of the star-forming region, and a short lifetime of the masers.
Acknowledgements
The author acknowledges financial support from the North-West University.
References
- Araya, E., Hofner, P., Linz, H., et al. 2004, ApJS, 154, 579 [NASA ADS] [CrossRef] [Google Scholar]
- Araya, E., Hofner, P., Goss, W. M., et al. 2006, ApJ, 643, L33 [Google Scholar]
- Araya, E., Hofner, P., Goss, W. M., et al. 2007, ApJS, 170, 152 [NASA ADS] [CrossRef] [Google Scholar]
- Araya, E. D., Hofner, P., Goss, W. M., et al. 2008, ApJS, 178, 330 [NASA ADS] [CrossRef] [Google Scholar]
- Araya, E. D., Olmi, L., Morales Ortiz, J., et al. 2015, ApJS, 221, 10 [Google Scholar]
- Avalos, M., Lizano, S., Rodríguez, L. F., Franco-Hernández, R., & Moran, J. M. 2006, ApJ, 641, 406 [Google Scholar]
- Baan, W. A., An, T., Klöckner, H.-R., & Thomasson, P. 2017, MNRAS, 469, 916 [NASA ADS] [CrossRef] [Google Scholar]
- Beltrán, M. T., Cesaroni, R., Neri, R., & Codella, C. 2011, A&A, 525, A151 [Google Scholar]
- Beuther, H., Linz, H., Henning, T., Feng, S., & Teague, R. 2017, A&A, 605, A61 [NASA ADS] [CrossRef] [EDP Sciences] [Google Scholar]
- Boland, W., & de Jong, T. 1981, A&A, 98, 149 [NASA ADS] [Google Scholar]
- Brunthaler, A., Menten, K. M., Dzib, S. A., et al. 2021, A&A, 651, A85 [EDP Sciences] [Google Scholar]
- Cesaroni, R., Beltrán, M. T., Moscadelli, L., Sánchez-Monge, Á., & Neri, R. 2019, A&A, 624, A100 [NASA ADS] [CrossRef] [EDP Sciences] [Google Scholar]
- Chatzikos, M., Bianchi, S., Camilloni, F., et al. 2023, Rev. Mexicana Astron. Astrofis., 59, 327 [Google Scholar]
- Chen, X., Shen, Z.-Q., Ellingsen, S. P., et al. 2017, ApJ, 851, L3 [NASA ADS] [CrossRef] [Google Scholar]
- Downes, D., Wilson, T. L., Bieging, J., & Wink, J. 1980, A&AS, 40, 379 [NASA ADS] [Google Scholar]
- Evans, II, N. J., Zuckerman, B., Morris, G., & Sato, T. 1975, ApJ, 196, 433 [NASA ADS] [CrossRef] [Google Scholar]
- Feng, S., Beuther, H., Semenov, D., et al. 2016, A&A, 593, A46 [NASA ADS] [CrossRef] [EDP Sciences] [Google Scholar]
- Gieser, C., Beuther, H., Semenov, D., et al. 2021, A&A, 648, A66 [EDP Sciences] [Google Scholar]
- Ginsburg, A., Darling, J., Battersby, C., Zeiger, B., & Bally, J. 2011, ApJ, 736, 149 [NASA ADS] [CrossRef] [Google Scholar]
- Ginsburg, A., Walsh, A., Henkel, C., et al. 2015, A&A, 584, L7 [NASA ADS] [CrossRef] [EDP Sciences] [Google Scholar]
- Goddi, C., Zhang, Q., & Moscadelli, L. 2015, A&A, 573, A108 [NASA ADS] [CrossRef] [EDP Sciences] [Google Scholar]
- Gong, Y., Ortiz-León, G. N., Rugel, M. R., et al. 2023, A&A, 678, A130 [NASA ADS] [CrossRef] [EDP Sciences] [Google Scholar]
- Hoare, M. G., Purcell, C. R., Churchwell, E. B., et al. 2012, PASP, 124, 939 [Google Scholar]
- Hoffman, I. M., Goss, W. M., Palmer, P., & Richards, A. M. S. 2003, ApJ, 598, 1061 [Google Scholar]
- Lizano, S. 2008, ASP Conf. Ser., 387, 232 [Google Scholar]
- Mahmut, U., Esimbek, J., Baan, W., et al. 2024, MNRAS, 528, 577 [Google Scholar]
- Mangum, J. G., & Wootten, A. 1993, ApJS, 89, 123 [Google Scholar]
- Mangum, J. G., Darling, J., Henkel, C., & Menten, K. M. 2013, ApJ, 766, 108 [NASA ADS] [CrossRef] [Google Scholar]
- McCauley, P. I., Mangum, J. G., & Wootten, A. 2011, ApJ, 742, 58 [Google Scholar]
- McCarthy, T. P., Orosz, G., Ellingsen, S. P., et al. 2022, MNRAS, 509, 1681 [Google Scholar]
- Mehringer, D. M., Goss, W. M., & Palmer, P. 1994, ApJ, 434, 237 [NASA ADS] [CrossRef] [Google Scholar]
- Nomura, H., & Millar, T. J. 2004, A&A, 414, 409 [CrossRef] [EDP Sciences] [Google Scholar]
- Okoh, D., Esimbek, J., Zhou, J. J., et al. 2014, Ap&SS, 350, 657 [Google Scholar]
- Purcell, C. R., Hoare, M. G., Cotton, W. D., et al. 2013, ApJS, 205, 1 [Google Scholar]
- Sandell, G., Goss, W. M., Wright, M., & Corder, S. 2009, ApJ, 699, L31 [NASA ADS] [CrossRef] [Google Scholar]
- Shuvo, O. I., Araya, E. D., Tan, W. S., et al. 2021, MNRAS, 504, 1733 [Google Scholar]
- Sternberg, A., Hoffmann, T. L., & Pauldrach, A. W. A. 2003, ApJ, 599, 1333 [NASA ADS] [CrossRef] [Google Scholar]
- Tang, X. D., Henkel, C., Menten, K. M., et al. 2018a, A&A, 609, A16 [NASA ADS] [CrossRef] [EDP Sciences] [Google Scholar]
- Tang, X. D., Henkel, C., Wyrowski, F., et al. 2018b, A&A, 611, A6 [NASA ADS] [CrossRef] [EDP Sciences] [Google Scholar]
- Townes, C. H., & Cheung, A. C. 1969, ApJ, 157, L103 [Google Scholar]
- Troscompt, N., Faure, A., Maret, S., et al. 2009, A&A, 506, 1243 [NASA ADS] [CrossRef] [EDP Sciences] [Google Scholar]
- van der Tak, F. F. S., van Dishoeck, E. F., Evans, II, N. J., & Blake, G. A. 2000, ApJ, 537, 283 [NASA ADS] [CrossRef] [Google Scholar]
- van der Walt, D. J. 2024, MNRAS, 534, 1787 [Google Scholar]
- van der Walt, D. J., & Mfulwane, L. L. 2022, A&A, 657, A63 [NASA ADS] [CrossRef] [EDP Sciences] [Google Scholar]
- van der Walt, D. J., Ginsburg, A., & Goddi, C. 2021, MNRAS, 501, 3871 [Google Scholar]
- Yang, A. Y., Urquhart, J. S., Thompson, M. A., et al. 2021, A&A, 645, A110 [EDP Sciences] [Google Scholar]
All Figures
|
Fig. 1 Comparison of the free-free SEDs used as examples. Filled black circles represent data for G24.78+0.08 A1 (Cesaroni et al. 2019). The solid black line is the SED calculated with Cloudy and normalised to the data at 44 GHz. The dashed black line is the theoretical SED with TK = 104K and EM = 1.3 × 10⁹ pc cm−6. The solid blue line is the SED calculated with Cloudy for the second example. The solid red line is a theoretical SED with TK = 104 K and EM = 3.9 × 10¹⁰ pc cm−6. |
| In the text | |
|
Fig. 2 Variation in τ14.8 and τ14.5 as a function of radial distance from the ionising star when the Cloudy SED for the hyper-compact H II region G24.78+0.08 A1 is used. The vertical dashed line represents the outer radius of the H II region. For case 1, nH2 (ro) = 105 cm−3 and TK(ro) = 150 K. For case 2, nH2 (ro) = 7 × 105 cm−3 and TK(ro) = 300 K. |
| In the text | |
|
Fig. 3 Variation in τ14.8 and τ14.5 as a function of radial distance from the ionising star when the Cloudy SED for the second example (blue line in Fig. 1) is used. Cases 1 and 2 correspond to those used in Fig. 2. |
| In the text | |
|
Fig. 4 Variation in τ14.8 as a function of radial distance from the ionising star when the Cloudy SED for the second example (blue line in Fig. 1) is used and when beaming is included. |
| In the text | |
|
Fig. 5 Variation in the free-free brightness temperature for G32.7441-0.0755 as derived from the publicly available CORNISH data. The vertical line represents the outer edge of the X-band emission estimated from the image in Yang et al. (2021). |
| In the text | |
|
Fig. 6 Radial distance dependence of the free-free brightness temperature at 4.8, 14.5, and 28.9 GHz for the second example presented in Sect. 3.1. |
| In the text | |
|
Fig. 7 Cumulative optical depth and excitation temperatures as a function of distance at 4.8 and 14.5 GHz. |
| In the text | |
Current usage metrics show cumulative count of Article Views (full-text article views including HTML views, PDF and ePub downloads, according to the available data) and Abstracts Views on Vision4Press platform.
Data correspond to usage on the plateform after 2015. The current usage metrics is available 48-96 hours after online publication and is updated daily on week days.
Initial download of the metrics may take a while.