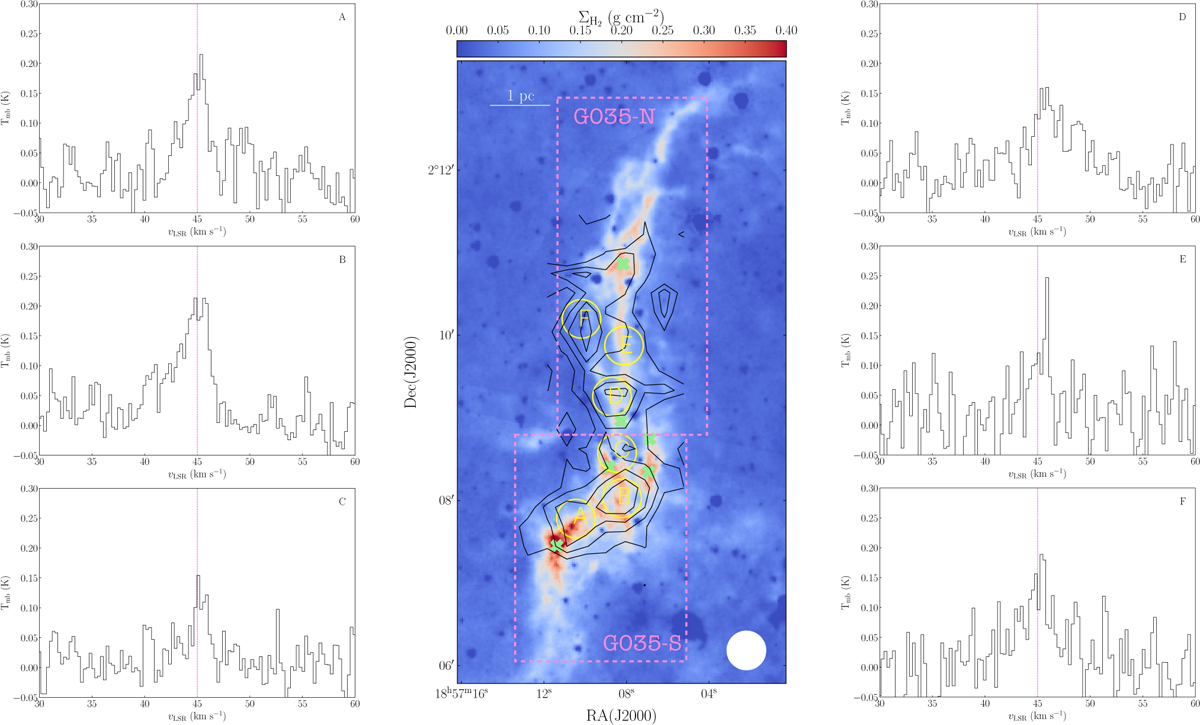
Fig. 1
Download original image
Middle: SiO(2−1) integrated intensity map (black contours) obtained towards the velocity range 38−50 km s−1. The emission contours, from 3σ(σ=0.07 K km s−1) by steps of 3σ, are superimposed on the mass surface density map (colour scale) obtained by Kainulainen & Tan (2013). The beam size and spatial scale are indicated in the bottom right and top left corners of the map, respectively. The location of the massive cores within the cloud is indicated with light green crosses (Rathborne et al. 2006; Butler & Tan 2012). The yellow circles, labelled from A to F, indicate the positions used to extract the SiO spectra. The dashed pink square separates the northern and southern parts of the cloud. Right and left: SiO(2−1) spectra extracted towards the six positions from A to F and using an aperture of 28′′, the size of the beam of the IRAM 30 m telescope at the frequency of the SiO(2−1) line. In each panel, the cloud velocity (vLSR=45.5 km s−1 Hernandez & Tan 2015) is indicated by a vertical dashed magenta line.
Current usage metrics show cumulative count of Article Views (full-text article views including HTML views, PDF and ePub downloads, according to the available data) and Abstracts Views on Vision4Press platform.
Data correspond to usage on the plateform after 2015. The current usage metrics is available 48-96 hours after online publication and is updated daily on week days.
Initial download of the metrics may take a while.