| Issue |
A&A
Volume 701, September 2025
|
|
|---|---|---|
| Article Number | A244 | |
| Number of page(s) | 9 | |
| Section | Interstellar and circumstellar matter | |
| DOI | https://doi.org/10.1051/0004-6361/202556057 | |
| Published online | 23 September 2025 | |
Low-velocity large-scale shocks in the infrared dark cloud G035.39-00.33: Bubble-driven cloud-cloud collisions
1
Institut de Radioastronomie Millimétrique,
300 Rue de la Piscine,
38400
Saint-Martin-d’Hères,
France
2
Centro de Astrobiología (CSIC/INTA),
Ctra. de Torrejón a Ajalvir km 4,
Madrid,
Spain
3
National Astronomical Observatories of China, Chinese Academy of Sciences,
Beijing
100012,
China
4
INAF Osservatorio Astronomico di Arcetri,
Largo E. Fermi 5,
50125
Florence,
Italy
5
Department of Space, Earth and Environment, Chalmers University of Technology,
412 96
Gothenburg,
Sweden
6
Department of Astronomy, University of Virginia,
530 McCormick Road Charlottesville,
22904-4325
USA
7
Astrophysics Research Institute, Liverpool John Moores University,
146 Brownlow Hill, Liverpool L3 5RF,
UK
8
European Southern Observatory (ESO), Karl-Schwarzschild-Straße 2,
85748
Garching bei München,
Germany
9
Max Planck Institute for Extraterrestrial Physics, Giessenbachstrasse 1,
85748
Garching bei München,
Germany
10
Laboratory for the study of the Universe and eXtreme phenomena (LUX), Observatoire de Paris, 5,
place Jules Janssen,
92195
Meudon,
France
11
Leiden Observatory, Leiden University,
PO Box 9513,
2300
RA Leiden,
The Netherlands
★ Corresponding author: This email address is being protected from spambots. You need JavaScript enabled to view it.
Received:
23
June
2025
Accepted:
7
August
2025
Abstract
Context. Low-velocity, large-scale shocks impacting on the interstellar medium have been suggested as efficient mechanisms that shape molecular clouds and trigger star formation within them.
Aims. These shocks, both driven by galactic bubbles and/or cloud-cloud collisions, leave specific signatures in the morphology and kinematics of the gas. Observational studies of such signatures are crucial to investigate if and how shocks affect the clouds formation process and trigger their future star formation.
Methods. We have analysed the shocked and dense gas tracers SiO(2−1) and H13 CO+(1−0) emission towards the Infrared Dark Cloud G035.39-00.33, using new, larger-scale maps obtained with the 30 m telescope at the Instituto de Radioastronomía Millimétrica.
Results. We find that the dense gas is organised into a northern filament and a southern one that have different velocities and tilted orientations with respect to each other. The two filaments, seen in H13 CO+, are spatially separated yet connected by a faint bridge-like feature also seen in a position-velocity diagram extracted across the cloud. This bridge feature, typical of cloud-cloud collisions, also coincides with a very spectrally narrow SiO-traced gas emission. We suggest that the northern filament is interacting with the nearby supernova remnant G035.6-0.4. Towards the southern filament, we also report the presence of a parsec-scale, spectrally narrow SiO emission likely driven by the interaction between this filament and a nearby expanding shell. The shell is visible in the 1.3 GHz and 610 MHz continuum images and our preliminary analysis suggests it may be the relic of a supernova remnant.
Conclusions. We conclude that the two filaments represent the densest part of two colliding clouds, pushed towards each other by nearby supernova remnants. We speculate that this cloud-cloud collision driven by stellar feedback may have assembled the infrared dark cloud. We also evaluate the possibility that star formation may have been triggered within G035.39-00.33 by the cloud-cloud collision.
Key words: ISM: bubbles / ISM: clouds / ISM: molecules / ISM: supernova remnants / ISM: individual objects: G035.39-00.33
© The Authors 2025
 Open Access article, published by EDP Sciences, under the terms of the Creative Commons Attribution License (https://creativecommons.org/licenses/by/4.0), which permits unrestricted use, distribution, and reproduction in any medium, provided the original work is properly cited.
This article is published in open access under the Subscribe to Open model. This email address is being protected from spambots. You need JavaScript enabled to view it. to support open access publication.
1 Introduction
Infrared dark clouds (IRDCs) are among the densest (n(H2)>103 cm−3; Chevance et al. 2023), coldest (T<25 K; Pillai et al. 2006; Rathborne et al. 2006), and most-extinct (Av>100 mag; Butler & Tan 2009, 2012) regions of the interstellar medium. First seen as dark silhouettes against the mid-infrared Galactic background (Egan et al. 1998; Perault et al. 1996), IRDCs are known to harbour the initial conditions of star and stellar cluster formation at a wide range of masses (Kauffmann et al. 2010; Tan et al. 2014; Moser et al. 2020). However, the mechanisms that ignite star formation in these objects are still under debate (see Chevance et al. 2023, for a review). Among different scenarios, parsec-scale low-velocity (10−20 km s−1) shocks have been proposed as key ingredients for the star formation potential of IRDCs (Inutsuka et al. 2015; Inoue et al. 2018; Kinoshita et al. 2021) that can compress the gas and trigger star formation in clouds. These shocks can develop at the interface of the collisions between pre-existent giant molecular clouds (cloud-cloud collisions; Tan 2000; Tasker & Tan 2009; Dobbs et al. 2015; Wu et al. 2017, 2020; Horie et al. 2024) and/or be driven by the expanding shells of HII regions and supernova remnants (SNRs) at late stages (Fukui et al. 2018b; Cosentino et al. 2019; Reach et al. 2019; Rico-Villas et al. 2020; Khullar et al. 2024).
Observationally, shocks can be identified by means of molecular species whose chemistry is susceptible to their effects. Among these, silicon monoxide (SiO) is a unique tracer of shocked gas that is usually extremely depleted in quiescent regions (χ<10−12; Martin-Pintado et al. 1992), but whose abundance is significantly enhanced by shocks propagating through dense clouds (Jiménez-Serra et al. 2005; Nath et al. 2008; Guillet et al. 2011). Indeed, shocks cause sputtering and erosion of dust grains and their icy mantles, releasing Si into the gas phase (Caselli et al. 1997; Schilke et al. 1997). The spatial morphology and line profiles of SiO are expected to be indicative of the spatial extent and velocity of the shock driving the emission (Jiménez-Serra et al. 2005, 2010; Cosentino et al. 2020). For instance, towards molecular outflows, the SiO emission reflects the high velocities and small spatial scales of the shocks, i.e. it is expected to be spatially compact and spectrally broad (e.g. Codella et al. 2013; Liu et al. 2020; Guerra-Varas et al. 2023). On the other hand, in cloud-cloud collisions, shocks are expected to extend over parsec scales and to have velocities ∼10 km s−1 (Tasker & Tan 2009; Liu et al. 2018b). As a consequence, SiO emission towards these regions is expected to be spatially widespread and spectrally narrow (Cosentino et al. 2018, 2022; Kim et al. 2023). Cloud-cloud collisions can also be identified observationally through the detection of the so-called ‘bridge-like feature’ in the low- and high-density gas kinematics. When collisions occur, position-velocity (pv) diagrams along the line of sight are expected to show two main velocity structures, corresponding to the colliding clouds, connected by a fainter bridge emission, i.e. the gas at the interface of the collision. The bridge feature has been extensively predicted by simulations (e.g. Haworth et al. 2015b,a) and observed towards several sources (e.g. Duarte-Cabral et al. 2011; Nakamura et al. 2012; Dewangan et al. 2018; Tokuda et al. 2019; Gong et al. 2019; Zeng et al. 2020; Ma et al. 2022; Kohno et al. 2025). The presence of a bridge feature accompanied by the detection of narrow and widespread SiO-traced gas emission (Jiménez-Serra et al. 2010; Cosentino et al. 2020) and/or bright dense gas emission (Priestley & Whitworth 2021) is usually considered a more conclusive observational proof of cloud-cloud collision. Shocks driven by galactic bubbles, i.e. HII regions and late stage SNRs, are also expected to be extended over parsec scales (Inutsuka et al. 2015), but their velocities can reach a few tens of km s−1 (Sashida et al. 2013; Cosentino et al. 2019; Reach et al. 2024). Hence, the associated SiO emission may be broader than in cloud-cloud collisions. Shocks driven by galactic bubbles can impact already-existent nearby IRDCs (Inoue et al. 2018) and therefore could explain the presence of non-coeval star populations that are commonly found in molecular clouds (e.g. Jerabkova et al. 2019).
A systematic search of widespread and narrow SiO emission has been reported by Jiménez-Serra et al. (2010) and Cosentino et al. (2018,2020) towards the well-known sample of 10 IRDCs presented by Butler & Tan (2009, 2012). Five out of the ten sources have been reported by the authors to show SiO emission that is widespread over a parsec scale and line profiles that are narrower than ∼3 km s−1, i.e. significantly narrower than what observed in molecular outflows. Inspections of these clouds surroundings at multiple IR and radio wavelengths have shown that all the five sources are associated and most likely interacting with extended bubbles in the form of HII regions and/or SNRs (Cosentino et al. 2019, 2020, ; Liu et al. in prep.). Within this sample, the IRDC G035.39-00.33, or cloud H following the nomenclature of Butler & Tan (2009, 2012), is a highly filamentary dense cloud whose northern part (thereafter G035.39-N) has been extensively studied (e.g. Jiménez-Serra et al. 2010; Nguyen Luong et al. 2011; Sokolov et al. 2017; Liu et al. 2018b). It shows a very complex kinematic structure, with the molecular gas being distributed in multiple sub-filaments separated in velocity space by just a few km s−1 (Henshaw et al. 2013, 2014; Jiménez-Serra et al. 2014). CO is highly depleted across the cloud (depletion factors larger than 5), indicating the predominance of a cold chemistry, typical of the initial conditions of star formation (Hernandez et al. 2011). As a consequence of the CO depletion, deuterated species such as N2 D+are enhanced across the cloud, with an average D/H ratio 0.04 (Barnes et al. 2016). Towards G035.39-N, the IRAM-30 m maps of the SiO(2−1) have revealed the presence of both a spectrally broad SiO emission, spatially associated with known embedded young stellar objects within the cloud and a narrow SiO component (linewidth ∼1 km s−1) that is widespread across the IRDC (Jiménez-Serra et al. 2010). It has been suggested that this narrow and widespread SiO emission is the result of a cloud-cloud collision event (Jiménez-Serra et al. 2010; Bisbas et al. 2017). Follow-up ALMA observations towards G035.39-N seem to indicate that the emission may instead be produced by the ongoing interaction between the cloud and the nearby SNR G035.6-0.4 (Liu et al., in prep.). Indeed, recent JCMT SCUBA2 images at 850 μ m (Shen et al. 2024) and MeerKat 1.3 GHz (Goedhart et al. 2024) observations have revealed that G035.39 is part of a larger complex, consisting of five molecular clouds embedded in an intricate network of expanding bubbles.
In this work we extend the study of the SiO emission towards the south of G035.39 (thereafter G035.39-S). We analyse the spatial distribution and line profile of the SiO emission across G035.39-south and investigate the mechanism through which this emission may be originating. For this, we also investigate the morphology and kinematics of the dense gas tracer H13 CO+. The paper is organised as follows. In Sect. 2 we discuss the data acquisition strategy and ancillary data used. In Sect. 3 we present our results. Finally, in Sect. 4 we discuss our findings and draw our conclusions.
2 Observations and data
2.1 IRAM-30 m data
In May 2013, the emission from SiO(2−1) and H13 CO+(1−0) molecular lines was mapped towards the full extent of G035.39, using the EMIR receiver (v=86.84696 GHz) on the 30 m antenna at the Instituto de Radioastronomia Millimetrica (Pico Veleta, Spain). Observations were performed in on-the-fly (OTF) mode using angular separation in the direction perpendicular to the scanning direction of 6′′. The obtained map has central co-ordinates RA (J 2000)=18h 57m 08s, Dec(J 2000)=2d 10m 30s and extent 300′′ × 480′′. During observations, an off position at (1830′′, 658′′) with respect to the central co-ordinates was used. During observations, the Versatile Spectrometric and Polarimetric Array (VESPA) was set to provide a spectral resolution of ∼40 kHz, corresponding to a velocity resolution of ∼0.14 km s−1 at the observed frequencies. Intensities were measured in units of the antenna temperature, TA*, and converted into main beam temperatures, Tmb=TA*(Beff/Feff), using beam and forward efficiencies of Be f f=0.81 and Fe f f=0.95, respectively. The final cubes were produced using the CLASS and MAPPING software within the GILDAS package and have a native resolution of 28′′, pixel size of 14′′, and root-mean-square (rms) per beam per channel of 55 mK. Any acronyms that are defined in the abstract need to be re-introduced in the main text. In order to improve the signal-to-noise ratio, all spectra were smoothed to a velocity ∼0.25 km s−1, producing a final rms per beam per channel of 40 mK. Finally, a first-grade polynomial baseline was subtracted from all spectra, pixel by pixel. We note that the molecular tracer emission obtained towards G035.39-N is consistent with that already presented by Jiménez-Serra et al. (2010), obtained using the previous generation of ABCD receivers on the IRAM-30 m.
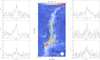 |
Fig. 1 Middle: SiO(2−1) integrated intensity map (black contours) obtained towards the velocity range 38−50 km s−1. The emission contours, from 3σ(σ=0.07 K km s−1) by steps of 3σ, are superimposed on the mass surface density map (colour scale) obtained by Kainulainen & Tan (2013). The beam size and spatial scale are indicated in the bottom right and top left corners of the map, respectively. The location of the massive cores within the cloud is indicated with light green crosses (Rathborne et al. 2006; Butler & Tan 2012). The yellow circles, labelled from A to F, indicate the positions used to extract the SiO spectra. The dashed pink square separates the northern and southern parts of the cloud. Right and left: SiO(2−1) spectra extracted towards the six positions from A to F and using an aperture of 28′′, the size of the beam of the IRAM 30 m telescope at the frequency of the SiO(2−1) line. In each panel, the cloud velocity (vLSR=45.5 km s−1 Hernandez & Tan 2015) is indicated by a vertical dashed magenta line. |
2.2 Green Bank Telescope Data
Observations of the C18 O(1−0) and 13 CO(1−0) emission towards G035.39 were performed in April 2021 (project code SOF09104), using the 100 m antenna at the Green Bank Telescope (GBT, West Virginia, USA). For the observations, the Argus 16-element array was used with a 4 × 4 configuration, where each element was separated by 30.4′′ in the plane spanned by the elevation and cross-elevation. Observations were performed in a fast mapping method that scanned the sky towards the Galactic longitude in parallel rows with a width of 5.58′′. The final maps have central co-ordinates RA(J2000) =34° 44′ 04′′, Dec(J 2000)=−0° 33′ 18′′, a beam size of ∼7′′, and a velocity resolution of ∼0.19 km s−1. The average integrated noise was estimated to be 0.294 K km/s for 13 CO and 0.209 K km/s for C18 O. We note that the C18 O(1−0) dataset is only minimally used and that a comprehensive analysis of the lower-density gas emission is beyond the scope of this work but will be presented in a forthcoming paper by Law et al., in prep.
3 Results
3.1 Low-velocity, large-scale shocks in G035.39
We first investigated the morphology and line profile of the SiO-traced gas across the IRDC G035.39, with a particular focus on the southern part of the cloud. In Fig. 1 we show the SiO(2−1) integrated intensity (38−50 km s−1) emission contours (black) as overlaid on the mass surface density map obtained by Kainulainen & Tan (2013) (central panel, colour scale). From Fig. 1, the cloud shows a very filamentary structure, with the northern filament almost vertical (oriented towards the north-south direction) and the southern one tilted by almost 45° with respect to it. The SiO emission is widespread across the cloud and follows its morphology closely. In particular, the newly mapped southern SiO emission also appears tilted by almost 45° with respect to the northern emission, which is instead oriented in a north-south direction (almost vertical). Towards G035.39-S, the location of the SiO emission peak does not coincide with the positions of known cores within the cloud (cyan crosses; Rathborne et al. 2006; Butler & Tan 2012) and it is extended across 2.4′, which corresponds to ∼2 pc at the source distance (2.9 kpc ; Simon et al. 2006). In Fig. 1, SiO spectra extracted towards a few positions in the north (right panels) and in south (left panels) of the cloud are shown. Positions A, B, and C are representative locations across the elongated southern SiO emission. Positions D, E, and F coincide with those investigated by Jiménez-Serra et al. (2010). Towards G035.39-N, both the broad (up to ∼20 km s−1; spectra D and F) and narrow (≤2 km s−1; spectrum E) SiO emission already identified by Jiménez-Serra et al. (2010) are clearly seen. Follow-up ALMA observations of this emission will be discussed in detail in the forthcoming paper by Liu et al. (in prep.). Towards G035.39-S, the narrowest SiO emission is observed towards position C, i.e. FWHM ∼1.8 km s−1, slightly larger than that of the narrow SiO emission reported by Jiménez-Serra et al. (2010). The brightest emission in G035.39-S is instead observed towards positions A and B. Towards these two positions, the spectra are slightly broader than towards position C(∼3 vs ∼2 km s−1), but still much narrower than what is reported towards the north of the cloud, i.e. positions D and F, where Liu et al. in prep. and Jiménez-Serra et al. (2010) reported linewidths as broad as ∼20 km s−1. In light of all this, the SiO emission towards G035.39-S can be considered as widespread over ∼2 pc and spectrally narrower than what is seen towards previously identified molecular outflows within the source.
3.2 Dynamical properties of the SiO-traced gas
From the SiO emission, we estimate the mass, momentum, and energy of the SiO-traced gas towards G035.39-S, using the method described in Dierickx et al. (2015):
 (1)
(1)
 (2)
(2)
 (3)
where d is the source kinematic distance (2.9 kpc ; Simon et al. 2006), μg=1.36 is the gas molecular weight, m(H2) is the molecular hydrogen mass, χ(SiO) is the SiO fractional abundance with respect to H2, and Σpix N(SiO)pix=(3.5 ± 0.7) × 1013 cm−2 is the total SiO column density, summed for all pixels above 3σ. Finally, v=8 km s−1 is the linewidth at the base (3 × rms) of the emission in the SiO spectrum averaged across G035.39-S. Similarly to what is described in Cosentino et al. (2022), we estimated χ(SiO) as follows:
(3)
where d is the source kinematic distance (2.9 kpc ; Simon et al. 2006), μg=1.36 is the gas molecular weight, m(H2) is the molecular hydrogen mass, χ(SiO) is the SiO fractional abundance with respect to H2, and Σpix N(SiO)pix=(3.5 ± 0.7) × 1013 cm−2 is the total SiO column density, summed for all pixels above 3σ. Finally, v=8 km s−1 is the linewidth at the base (3 × rms) of the emission in the SiO spectrum averaged across G035.39-S. Similarly to what is described in Cosentino et al. (2022), we estimated χ(SiO) as follows:
 (4)
where N(SiO)=(1.9 ± 0.2) × 1012 cm−2 and N(H13 CO+)= (2.0 ± 0.3) × 1012 cm−2 were calculated towards the SiO emission peak, using Eq. (A4) in Caselli et al. (2002). Both this and the previous values of SiO column densities were calculated assuming local thermodynamic equilibrium (LTE). We note that, since the SiO emission is due to shocks, LTE conditions may not be representative of the gas. However, a non-LTE analysis, i.e. a large velocity gradient analysis with RADEX (van der Tak et al. 2007) would require observations of multiple SiO rotational transitions that are not available at this stage. Moreover, higher-J transitions such as the SiO(3−2) have been seen to be either very week or undetected towards G035.39-N (Jiménez-Serra et al. 2010). This would most likely also be the case towards G035.39-S, where the SiO emission is even narrower. Observations of the SiO(1−0) transition would therefore be the most suitable but are not currently available. In addition to this, we also note that while the method described by Dierickx et al. (2015) is typically used to infer physical parameters in molecular outflows, this has also been used in the literature for other shell-driven shocks and ultra-high-velocity gas associated with nearby SNRs (e.g. Yamada et al. 2017; Tsujimoto et al. 2018). Other methods may require a more in-depth knowledge of the shock driving source, which is not the case for this work. Hence, we consider the estimates provided here to be approximate estimates and the calculation will be revisited when more data become available.
(4)
where N(SiO)=(1.9 ± 0.2) × 1012 cm−2 and N(H13 CO+)= (2.0 ± 0.3) × 1012 cm−2 were calculated towards the SiO emission peak, using Eq. (A4) in Caselli et al. (2002). Both this and the previous values of SiO column densities were calculated assuming local thermodynamic equilibrium (LTE). We note that, since the SiO emission is due to shocks, LTE conditions may not be representative of the gas. However, a non-LTE analysis, i.e. a large velocity gradient analysis with RADEX (van der Tak et al. 2007) would require observations of multiple SiO rotational transitions that are not available at this stage. Moreover, higher-J transitions such as the SiO(3−2) have been seen to be either very week or undetected towards G035.39-N (Jiménez-Serra et al. 2010). This would most likely also be the case towards G035.39-S, where the SiO emission is even narrower. Observations of the SiO(1−0) transition would therefore be the most suitable but are not currently available. In addition to this, we also note that while the method described by Dierickx et al. (2015) is typically used to infer physical parameters in molecular outflows, this has also been used in the literature for other shell-driven shocks and ultra-high-velocity gas associated with nearby SNRs (e.g. Yamada et al. 2017; Tsujimoto et al. 2018). Other methods may require a more in-depth knowledge of the shock driving source, which is not the case for this work. Hence, we consider the estimates provided here to be approximate estimates and the calculation will be revisited when more data become available.
For the column density estimate, we assume an excitation temperature of Tex=9 K, as was reported by Jiménez-Serra et al. (2010) for the narrow SiO emission towards G035.39.39-N. The assumed value is also consistent with the excitation temperature inferred by Cosentino et al. (2018,2022) towards two low-velocity parsec-scale shocks driven by the SNRs W44 and IC443. In accordance with these studies, we also assume an uncertainty of 20% on Tex. The uncertainties on the column densities have been estimated by propagating this and an additional 10% uncertainty due to the rms. Finally, we assume 13 C /12 C=53 ± 10 (Milam et al. 2005) and χ(HCO+)=(1 ± 0.5) × 10−8 (van Dishoeck et al. 1993). With this method, we estimate an SiO fractional abundance of χ(SiO)=(1 ± 0.6) × 10−10, which in turn gives mass, momentum, and energy of the SiO-traced gas M=175 ± 90 M☉, P= (1.4 ± 0.8) × 103 M☉ km s−1, and E=(1.1 ± 0.6) × 1041 erg, respectively. We note that this energy estimate is the kinetic energy of the SiO-traced gas and does not correspond to the full energy released by the shock. Indeed, only a small fraction of the shock energy is expected to be dissipated through gas turbulent motion (Park & Ryu 2019). Finally, for our estimates of P and E, we have considered the width of the SiO(2−1) line at the base of the emission. If we were to consider only the energy contribution from the SiO gas bulk motion then we would need to consider as a typical linewidth the average SiO velocity dispersion across the cloud, σv ∼1.5−2 km s−1, and the energy would be E=3/2 Mσv. We would then obtain P ∼400 M☉ km s−1 and E ∼1040 erg. These values are also incompatible with those measured towards molecular outflows.
Towards G035.39, Nguyen Luong et al. (2011) investigated the 70 μ m emission obtained with Herschel and reported the presence of five deeply embedded protostars towards the south of the cloud, which the authors classified as IR-quiet massive dense cores. The energy of molecular outflows powered by highmass (∼1046 ergs; Zhang et al. 2005; López-Sepulcre et al. 2009; Liu et al. 2025) and even intermediate-mass (∼1043−1044 ergs; Beltrán et al. 2006, 2008) sources is several order of magnitude higher that the energy measured for the SiO-traced gas towards G035.39-S. Similarly, the mass and momentum reported here are up to three orders of magnitude higher than those typically reported for molecular outflows powered by low-mass protostars (Dunham et al. 2016). We also note that no significant SiO(5−4) emission is present towards the cores in G035.39-S, as was reported by Liu et al. (2018a) using ALMA single-pointing observations. Hence, although some minimal contribution from molecular outflows may be present, it is unlikely that the SiO emission towards G035.39-S is dominated by ongoing star formation activity. Therefore additional mechanisms need to be considered.
3.3 Signature of cloud-cloud collision in G035.39
We now study the morphology and kinematics of the dense gas tracer H13 CO+(1−0) across the full extent of G035.39. In Fig. 2 we show the spatial distribution (integrated intensity map over the range 42−48 km s−1; left panel) and velocity field (moment 1 map ; right panel) of the dense gas tracer emission. In both panels, the SiO emission contours (black) from Fig. 1 and the 0.1 g cm−2 mass surface density contour (cyan) are superimposed. From Fig. 2, the dense gas tracer emission is organised into two filamentary structures that closely follow the G035.39-N and G035.39-S morphologies, respectively. Again, while the northern filament appears almost vertical across the north-south direction, the southern filament is tilted towards the east by ∼45° with the respect to it. As is seen from the H13 CO+velocity map, the G035.39-N and G035.39-S filaments do not just appear to have different spatial orientations; they also are kinematically separated by ∼1−1.5 km s−1, with velocities of ∼45.5−46.5 km s−1 and ∼44.5−45 km s−1, respectively. This velocity separation is >3 δ v, and hence significant within the velocity resolution. Towards the centre of the source, the two components mix and the dense gas presents intermediate velocities between ∼45−45.5 km s−1. This kinematic structure is similar to that expected in cloud-cloud collisions events, i.e. two velocity components connected by a fainter bridge emission. Hence, we have extracted a pv (pv) diagram across the yellow curve in Fig. 2, and this is shown in Fig. 3.
From the pv diagram in Fig. 3, the bridge emission connecting the northern and southern filaments of G035.39 is clearly seen. The narrowest SiO line profile detected across the cloud is spatially associated with the bridge feature. This region was not covered by the map presented in Jiménez-Serra et al. (2010) and it is at the very edge of the SiO ALMA map that will be presented by Liu et al. in prep. On the other hand, the SiO emission towards G035.39-S does not seem either spatially or kinematically associated with the bridge feature. As was already reported in previous sections, this emission is not due to ongoing star formation activity and it shows a different orientation with respect to the northern emission. Moreover the SiO emission towards G035.39-S is overall slightly blueshifted compared to the bulk of the northern SiO emission (see spectra A, B, C versus spectra D, E, and F in Fig. 1). Hence, although the two emissions are not completely kinematically separated, it may be that the bulk of the northern and southern SiO emission have different drivers.
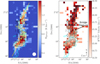 |
Fig. 2 Left: H13 CO+(1−0) integrated intensity map (colour scale) obtained towards the velocity range 42−48 km s−1. The zero level of the colour bar corresponds to 3σ(σ=0.1 K km s−1). The yellow line indicates the path used to extract the pv diagrams shown in Fig. 3. Along this curve, the intermediate endpoints are marked as A0 and A1. The beam size is indicated in the bottom right of the map. The location of the massive cores within the cloud is indicated with light green crosses (Rathborne et al. 2006; Butler & Tan 2012). Right: velocity map (colour scale) of the H13 CO+(1−0) emission with the dense gas tracer and mass surface density emission contours superimposed as in the left panel. Only pixels with an integrated intensity above 3σ are shown. The north and east directions are indicated in the bottom right corner. In both panels, the SiO emission contours, from 3σ(σ=0.07 K km s−1) by steps of 3σ, and the 0.1 g cm−2 mass surface density contour (visual extinction ∼20 mag) are superimposed (Kainulainen & Tan 2013). |
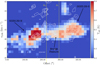 |
Fig. 3 Position-velocity (pv) diagram of the H13 CO+emission (colour scale) extracted across the yellow curve seen in the left panel of Fig. 2. The vertical dashed yellow lines correspond to the endpoints A0 and A1 indicated in Fig. 2. The white contours corresponds to the SiO pv diagram extracted along the same curve from 3σ (σ=0.03 K) by steps of 3σ. |
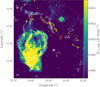 |
Fig. 4 1.3 GHz emission (colour scale) image obtained with MeerKat (Goedhart et al. 2024) towards G035.39 and its surroundings. The yellow contours corresponds to 0.1 g cm−2 in the mass surface density map of Kainulainen & Tan (2013) and highlights the shape and location of the IRDC. The white contour corresponds to the 3σ(σ=0.0004) emission level in the GMRT image at 610 MHz from Paredes et al. (2014). The dashed red circle indicates the location of the putative bubble. |
3.4 The G035 complex as a bubble-driven cloud-cloud collision
In order to identify these shock drivers, we inspected the publicly available MeerKat 1.3 GHz image Goedhart et al. (2024) towards and around G035.39, which is shown in Fig. 4.
As is seen from Fig. 4, G035.39 is located within a complex network of Galactic bubbles (Shen et al. 2024). The brightest of these, located towards the south-east of the image, is the SNR G035.6-0.4 (Paredes et al. 2014; Green 2019). The compact source towards the north-west is the HII region G035.43-00.26, already reported in the WISE Catalogue of of HII regions by Anderson et al. (2014). Towards the same region, a fainter bubble-like structure (red dashed circle) is present both in the MeerKat and Giant Metrewave Radio Telescope (GMRT) images (see colour scale and white contours, respectively), spatially associated with G035.39-S. This structure is not reported in either the WISE Catalogue of HII regions (Anderson et al. 2014) or the Catalogue of Galactic Supernovae by Green (2019) and most likely has not yet been classified. We note that this faint bubble is not associated with the compact, bright source also encompassed by the dashed red circle. This additional compact source is indeed the HII regions G034.4+0.23, which has VL S R ∼60 km s−1 (Watson et al. 2003), i.e. it is kinematically distinct from both the gas associated with G035.39 and the fainter bubble. A rough estimate of the spectral index at different locations across the source gives α ∼−0.51, consistent with typical values measured in SNRs (Ranasinghe & Leahy 2023). Further investigations are needed to fully characterise the nature of the bubble.
In Fig. 5, a zoom-in view of the MeerKat image, centred on G035.39, is displayed. Overlaid on this, we show integrated intensity maps of the lower-dense gas tracer 13 CO(1−0) (left panel) and C18 O(1−0) (right panel) emission obtained with the 100 m antenna at the Green Bank Telescope. The white and orange shadows correspond to integration ranges of 45.5–46.5 km s−1 and 44−45.5 km s−1, respectively, i.e. consistent with the velocity of the dense gas towards G035.39-N and G035.39-S. The two velocity structures are seen in both tracers, but they appear more extended in 13 CO. For the integrated intensity maps, we calculated the integrated noise as  . In both cases, the velocity resolution is δ v ∼0.19 km s−1, while the rms is 0.3 K and 0.6 K for 13 CO and C18 O, respectively. Nc h corresponds to the number of channels within each integration range, i.e. Nc h=13 and 6 for the map integrated over the velocity range 45.5−46.5 km s−1 and Nc h=24 and 8 for the map obtained over the velocity range 44−45.5 km s−1, for 13 CO and C18 O, respectively. From Fig. 5, the C18 O emission towards G035.39-S (orange shadow) closely follows the curve of the shell seen at 1.3 GHz (red circle), as well as the lower mass surface density material of the cloud (Σ<0.1 g cm−2). Hence, the identified bubble not just spatially overlaps with the G035.39-S, but also seems to be kinematically associated with it. Therefore, the dense filament seen in H13 CO+towards G035.39-S is most likely the densest part of a much larger filament that is being pushed by the expansion of the bubble.
Additional evidence of shock compression in the gas kinematics is usually seen in the form of line broadening and/or by the presence of cavity-like structure in position velocity diagrams (Chen et al. 2017; Fukui et al. 2018a; Chen et al. 2025). Due to the relatively narrow linewidth of the SiO-traced gas, this is likely driven by a low velocity shock. Hence, significant line broadening is neither expected nor observed in the 13 CO and C18 O(1−0) emission. In order to identify cavity-like structures, in Fig. 6 we show the pv diagram obtained from the 13 CO(1−0) cube along a constant declination (colour scale). The same pv diagram has been obtained for the H13 CO+(1−0) emission (white contours).
From Fig. 6, the 13 CO kinematic structure hints at the presence of two cavity-like structures are identified in the 13 CO pv diagram. An almost vertical cavity is in spatial contact with G035.39-N and corresponds to the direction in which the SNR G35.6-0.4 is expanding (Liu et al., in prep.). A horizontal, more extended, cavity-like structure is in spatial contact with G035.39-S and corresponds to the expanding shell of the putative bubble identified in this work. A more detailed analysis of the lowerdensity gas kinematics is needed to fully ascertain the link between the two cavity-like structures and the filaments. This analysis will be presented in a forthcoming work (Law et al., in prep.). The H13 CO+pv diagram extract along the same direction is also shown in Fig. 6 (white contours). The two filaments, G035.39-N (redshifted) and G035.39-S (blueshifted), connected by the bridge-like feature are clearly identified. The overall H13 CO+kinematics resemble that of a V-shaped gas distribution, with the V pointing towards north. Such a kinematics has been reported to be associated with cloud-cloud and filament-cloud collision events (Arzoumanian et al. 2018; Fukui et al. 2018b).
4 Discussion and conclusions
The mechanisms responsible for initiating star formation in IRDCs are still unknown. Slow shocks extending over parsec scales and impacting on molecular clouds may efficiently regulate star formation in these objects as well as shaping their morphology (e.g. Khullar et al. 2024). Both cloud-cloud collision events and expanding shells of Galactic bubbles are regarded as drivers of such shocks (Inutsuka et al. 2015) and have been proposed as key ingredients for initiating star formation in molecular clouds. In this work, we have looked for signatures of large-scale low-velocity shocks towards the IRDC G035.39–00.33. We have used IRAM-30 m observations of the SiO and H13 CO+emission to investigate the morphology, kinematics, and line profiles of the shocked and dense gas across the cloud.
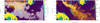 |
Fig. 5 1.3 GHz emission (colour scale) image obtained with MeerKat (Goedhart et al. 2024) towards G035.39. The yellow contours corresponds to 0.1 g cm−2 in the mass surface density map of Kainulainen & Tan (2013) and highlights the shape and location of the IRDC. The white (44–45.5 km s−1) and orange (45.5−46.5 km s−1) shadows correspond to the integrated intensity maps of the 13 CO(1−0) (left panel) and C18 O(1−0) emission (right panel) obtained with the Green Bank Telescope 100 m antenna. The orange shadows correspond to integrated emission larger than 3σ for both the 13 CO(σ=0.4 K km s−1) and C18 O emission (σ=0.15 km s−1). The white shadows correspond to integrated emission larger than 6σ for the 13 CO emission (σ=0.5 K km s−1) and 3σ for the C18 O emission (σ=0.17 km s−1). |
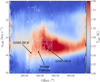 |
Fig. 6 Pv diagram obtained by collapsing the 13CO(1-0) (colour scale) and H13 CO+(1-0) (white contours) cubes along the declination axis. H13CO+contours are from 3σ(σ=0.015 K) in steps of 3σ. |
4.1 The origin of the SiO emission in G035.39
From the analysis of the dense gas emission, we find that the cloud is organised into two filaments, the northern (G035.9-N) and the southern (G035.39-S) filaments, tilted by ∼45° with respect to each other. Moreover, while G035.9-N has velocities between ∼45.5−46.6 km s−1, the southern filament is slightly blueshifted (45.5−44 km s−1). Towards the centre of the cloud, the two filaments coexist and seem to be connected by a fainter bridge-like emission, also seen in the position velocity diagram. The narrow SiO emission identified across the cloud is spatially and kinematically coincident with this bridge emission. This is clear evidence of an ongoing cloud-cloud interaction towards the IRDC, i.e. the two filaments represent the densest part of two colliding clouds, also seen in C18 O(1−0) emission, while the narrow SiO emission traces the shock interface between them. This confirms the scenario of cloud-cloud collisions towards the IRDC G035.39 previously suggested by Jiménez-Serra et al. (2010) and later by Henshaw et al. (2014); Bisbas et al. (2018); Liu et al. (2018b) through indirect evidence.
Besides the very narrow SiO emission associated with the bridge-like feature and located towards the centre of the cloud, we detect additional SiO-traced gas emission that is widespread across the cloud. The broad and narrow SiO emission towards G035.39-N was first identified by Jiménez-Serra et al. (2010) and recently studied at a high angular resolution by Liu et al. in prep. Taking advantage of the high-angular resolution of the ALMA images, the authors confirmed that the broad SiO emission is powered by molecular outflows, while the narrow (<2 km s−1) component is most likely due to the ongoing interaction between G035.39-N and the nearby SNR G035.6-0.4 (Paredes et al. 2014; Green 2019). Towards G035-39-S, we also find SiO emission whose line profiles are narrower that 3 km s−1 and that is extended over more than 2 pc. Note that narrow line profiles with typical FWHM ≤3 km s−1 have been found to be associated with the interaction between the SNR W44 and the IRDC G034.77-55 (Cosentino et al. 2018, 2019, see below). Also, the mass, momentum, and energy estimated for the SiO-traced gas are not consistent with those typically observed in molecular outflows associated with low-, intermediate-, and high-mass forming stars. Hence, ongoing star formation activity from the five deeply embedded sources identified is unlikely to be the only driver of the SiO-traced gas emission towards G034.39-S. A similar argument was presented by Nguyen Luong et al. (2011) for the northern narrow SiO emission. Furthermore, the energy and momentum associated with the SiO emission are consistent with those observed towards other SNR-driven shocks (Sashida et al. 2013; Cosentino et al. 2022). However, with the data currently available it is not possible to completely rule out the star formation activity scenario. We cannot exclude the presence of additional unresolved and deeply embedded low-mass protostars that may be driving outflows and hence the observed SiO emission, as has been seen towards other IRDCs (e.g., Foster et al. 2014). Future higher-resolution observations targeting both the molecular gas and embedded continuum sources, as well as sensitive mid-IR observations with JWST, will be crucial to disentangle between the two scenarios.
4.2 Stellar-feedback-driven cloud-cloud collision
The IRDC G035.39 is part of the more extended G035 complex and it is surrounded by both HII regions and SNRs. In particular, we find that the southern filament G035.39-S is spatially and kinematically associated with a shell-like structure not yet reported in the most up-to-date catalogue of galactic HII regions and SNRs (Anderson et al. 2014; Green 2019). Our rough estimated of the bubble spectral index (α ∼−0.5; Sect. 3.4) seems to indicate that this may be the relic of a SN explosion. This is not unlikely since within the immediate surroundings of G035.39 at least two additional SNRs of similar age (20−30 kyr) are present, i.e. G035.6-0.4 (Paredes et al. 2014; Green 2019) and W44 (Wootten 1978; Cosentino et al. 2019). The SNR W44 is interacting with the known IRDC G034.77-00.55 and, at the shock interface, the SiO linewidths are similar to those reported here towards G035.39 (Cosentino et al. 2018, 2019). We also note that the narrow SiO emission detected towards G 035.39−S is consistent with that identified towards other IRDCs embedded into bubbles networks (Cosentino et al. 2020). The mass, momentum, and energy estimated here for the SiO-traced gas are also consistent with those reported by Cosentino et al. (2022) towards the interaction site between the SNR IC443 and the clump G. We thus conclude that the SiO emission towards G 035.39−S is likely due to the interaction between this putative SNR and the cloud. Hence, the IRDC G035.39 consists of two colliding filaments, pushed towards each other by nearby external stellar feedback in the form of SNRs, i.e. the SNR G035.6-0.4 pushing the northern filament and the putative unclassified bubble sweeping up the southern filament. This event may therefore be considered a stellar-feedback-driven cloud-cloud collision, i.e. not due to the clouds’ natural shear motion but rather to expanding galactic gas. This scenario seems to also be supported by the presence of a cavity-like strcuture in the 13 CO pv diagram. However, the highly complex kinematic structure of the cloud (Liu et al. 2018b) needs to be investigated in more detail and at a higher angular resolution. Therefore, at this stage we cannot fully exclude the alternative scenario that the monolithic, pre-existent G035.39 filament may have been impacted by the nearby expanding shell, causing the observed bent structure towards the south of the cloud.
The idea that cloud-cloud collisions may occur as a consequence of the expansion of galactic shells into the interstellar medium was first introduced by Inutsuka et al. (2015) and more recently observationally investigated by Cosentino et al. (2020). Towards G035.39, our results support the idea that a stellar-feedback-driven cloud-cloud collisions is occurring and that this may have helped to assemble the IRDC with its current morphology. Hence, expanding on what is suggested in Cosentino et al. (2020), this type of cloud-cloud collisions may also need to be considered as an IRDC formation mechanism and further theoretical and observational studies are needed. Observational evidence of dense clouds located in between multiple bubbles have already been reported, for instance towards the W41 complex (Hogge et al. 2019) and W44 (Cosentino et al. 2019), and they may not be rare. However, our study suggests that, while stellar-feedback-driven cloud-cloud collisions leave on the newly formed IRDC similar footprint than those detected in natural occurring cloud-cloud collisions, a multi-wavelength approach is crucial to discern between the two scenarios.
Finally, we note that with the data in hand, it is challenging to assess whether the observed low-velocity, large-scale shocks may have ignited the ongoing star formation within G035.39. The location of the massive cores reported by Nguyen Luong et al. (2011) closely follows the orientation of the SiO-traced gas emission towards G035.39-S. These sources are classified as IR-quiet, and hence they may not have reached the proto-stellar phase yet. Towards G035.39-N, Liu et al., in prep. estimate the dynamical age of the molecular outflows to be lower than the SNR age. Hence, it is possible that some star formation may have been triggered by the stellar feedback cloud-cloud collision. However, higher-angular resolution images of dense gas tracers, such as N2 H+, are needed to resolve the typical core spatial scales at which these star formation signatures are seen.
In conclusion, we report evidence of a cloud-cloud collision towards the IRDC G035.39 that may have been driven by the expanding shells of two nearby SNRs. The two colliding clouds are still visible in the kinematics of the dense gas emission. Low-velocity, large-scale shocks are seen both at the interface of the collision as well as towards the site of interaction between the expanding shells and the swept-up filaments. Higher-angular-resolution and multi-wavelength observations are needed to unveil whether star formation has been triggered by these shocks. Our study indicates that stellar feedback cloud-cloud collisions may be more ubiquitous than what has been suggested so far and that multi-wavelength, multi-scale observations need to be combined to fully distinguish between stellar feedback and naturally occurring cloud-cloud collisions.
Acknowledgements
This work is based on observations carried out under project number 134-12 with the IRAM 30 m telescope. IRAM is supported by INSU/CNRS (France), MPG (Germany) and IGN (Spain). J.C.T. acknowledges support from ERC project 788829-MSTAR. I.J.-S. acknowledges funding from grant No. PID2019-105552RB-C41 awarded by the Spanish Ministry of Science and Innovation/State Agency of Research MCIN/AEI/10.13039/501100011033. J.D.H. gratefully acknowledges financial support from the Royal Society (University Research Fellowship; URF/R1/221620). R.F. acknowledges support from the grants Juan de la Cierva FJC2021-046802-I, PID2020-114461GB-I00 and CEX2021-001131-S funded by MCIN/AEI/10.13039/501100011033 and by “European Union NextGenerationEU/PRTR”. S.V. acknowledges partial funding from the European Research Council (ERC) Advanced Grant MOPPEX 833460. S.V. and J.C.T acknowledge the support from a Royal Society International Exchanges Scheme grant (IES/R3/170325).
References
- Anderson, L. D., Bania, T. M., Balser, D. S., et al. 2014, ApJS, 212, 1 [Google Scholar]
- Arzoumanian, D., Shimajiri, Y., Inutsuka, S.-i., Inoue, T., & Tachihara, K., 2018, PASJ, 70, 96 [Google Scholar]
- Barnes, A. T., Kong, S., Tan, J. C., et al. 2016, MNRAS, 458, 1990 [NASA ADS] [CrossRef] [Google Scholar]
- Beltrán, M. T., Girart, J. M., & Estalella, R., 2006, A&A, 457, 865 [NASA ADS] [CrossRef] [EDP Sciences] [Google Scholar]
- Beltrán, M. T., Estalella, R., Girart, J. M., Ho, P. T. P., & Anglada, G., 2008, A&A, 481, 93 [NASA ADS] [CrossRef] [EDP Sciences] [Google Scholar]
- Bisbas, T. G., Tanaka, K. E. I., Tan, J. C., Wu, B., & Nakamura, F., 2017, ApJ, 850, 23 [NASA ADS] [CrossRef] [Google Scholar]
- Bisbas, T. G., Tan, J. C., Csengeri, T., et al. 2018, MNRAS, 478, L54 [NASA ADS] [CrossRef] [Google Scholar]
- Butler, M. J., & Tan, J. C., 2009, ApJ, 696, 484 [NASA ADS] [CrossRef] [Google Scholar]
- Butler, M. J., & Tan, J. C., 2012, ApJ, 754, 5 [Google Scholar]
- Caselli, P., Hartquist, T. W., & Havnes, O., 1997, A&A, 322, 296 [NASA ADS] [Google Scholar]
- Caselli, P., Benson, P. J., Myers, P. C., & Tafalla, M., 2002, ApJ, 572, 238 [Google Scholar]
- Chen, X., Xiong, F., & Yang, J., 2017, A&A, 604, A13 [NASA ADS] [CrossRef] [EDP Sciences] [Google Scholar]
- Chen, E., Chen, X., Fang, M., et al. 2025, ApJ, 985, 120 [Google Scholar]
- Chevance, M., Krumholz, M. R., McLeod, A. F., et al. 2023, ASP Conf. Ser., 534, 1 [NASA ADS] [Google Scholar]
- Codella, C., Viti, S., Ceccarelli, C., et al. 2013, ApJ, 776, 52 [NASA ADS] [CrossRef] [Google Scholar]
- Cosentino, G., Jiménez-Serra, I., Henshaw, J. D., et al. 2018, MNRAS, 474, 3760 [NASA ADS] [Google Scholar]
- Cosentino, G., Jiménez-Serra, I., Caselli, P., et al. 2019, ApJ, 881, L42 [NASA ADS] [CrossRef] [Google Scholar]
- Cosentino, G., Jiménez-Serra, I., Henshaw, J. D., et al. 2020, MNRAS, 499, 1666 [NASA ADS] [CrossRef] [Google Scholar]
- Cosentino, G., Jiménez-Serra, I., Tan, J. C., et al. 2022, MNRAS, 511, 953 [NASA ADS] [CrossRef] [Google Scholar]
- Dewangan, L. K., Ojha, D. K., Zinchenko, I., & Baug, T., 2018, ApJ, 861, 19 [NASA ADS] [CrossRef] [Google Scholar]
- Cosentino, G., et al. A&A proofs, manuscript no. aa56057–25 [Google Scholar]
- Dierickx, M., Jiménez-Serra, I., Rivilla, V. M., & Zhang, Q., 2015, ApJ, 803, 89 [Google Scholar]
- Dobbs, C. L., Pringle, J. E., & Duarte-Cabral, A., 2015, MNRAS, 446, 3608 [CrossRef] [Google Scholar]
- Duarte-Cabral, A., Dobbs, C. L., Peretto, N., & Fuller, G. A., 2011, A&A, 528, A50 [NASA ADS] [CrossRef] [EDP Sciences] [Google Scholar]
- Dunham, M. M., Offner, S. S. R., Pineda, J. E., et al. 2016, ApJ, 823, 160 [NASA ADS] [CrossRef] [Google Scholar]
- Egan, M. P., Shipman, R. F., Price, S. D., et al. 1998, ApJ, 494, L199 [Google Scholar]
- Foster, J. B., Arce, H. G., Kassis, M., et al. 2014, ApJ, 791, 108 [NASA ADS] [CrossRef] [Google Scholar]
- Fukui, Y., Ohama, A., Kohno, M., et al. 2018a, PASJ, 70, S46 [NASA ADS] [Google Scholar]
- Fukui, Y., Torii, K., Hattori, Y., et al. 2018b, ApJ, 859, 166 [Google Scholar]
- Goedhart, S., Cotton, W. D., Camilo, F., et al. 2024, MNRAS, 531, 649 [CrossRef] [Google Scholar]
- Gong, Y., Tang, X. D., Henkel, C., et al. 2019, A&A, 632, A115 [NASA ADS] [CrossRef] [EDP Sciences] [Google Scholar]
- Green, D. A., 2019, J. Astrophys. Astron., 40, 36 [Google Scholar]
- Guerra-Varas, N., Merello, M., Bronfman, L., et al. 2023, A&A, 677, A148 [NASA ADS] [CrossRef] [EDP Sciences] [Google Scholar]
- Guillet, V., Pineau Des Forêts, G., & Jones, A. P., 2011, A&A, 527, A123 [NASA ADS] [CrossRef] [EDP Sciences] [Google Scholar]
- Haworth, T. J., Shima, K., Tasker, E. J., et al. 2015a, MNRAS, 454, 1634 [NASA ADS] [CrossRef] [Google Scholar]
- Haworth, T. J., Tasker, E. J., Fukui, Y., et al. 2015b, MNRAS, 450, 10 [NASA ADS] [CrossRef] [Google Scholar]
- Henshaw, J. D., Caselli, P., Fontani, F., et al. 2013, MNRAS, 428, 3425 [NASA ADS] [CrossRef] [Google Scholar]
- Henshaw, J. D., Caselli, P., Fontani, F., Jiménez-Serra, I., & Tan, J. C., 2014, MNRAS, 440, 2860 [Google Scholar]
- Hernandez, A. K., & Tan, J. C., 2015, ApJ, 809, 154 [NASA ADS] [CrossRef] [Google Scholar]
- Hernandez, A. K., Tan, J. C., Caselli, P., et al. 2011, ApJ, 738, 11 [NASA ADS] [CrossRef] [Google Scholar]
- Hogge, T. G., Jackson, J. M., Allingham, D., et al. 2019, ApJ, 887, 79 [NASA ADS] [CrossRef] [Google Scholar]
- Horie, S., Okamoto, T., & Habe, A., 2024, MNRAS, 527, 10077 [Google Scholar]
- Inoue, T., Hennebelle, P., Fukui, Y., et al. 2018, PASJ, 70, S53 [NASA ADS] [Google Scholar]
- Inutsuka, S.-i., Inoue, T., Iwasaki, K., & Hosokawa, T., 2015, A&A, 580, A49 [NASA ADS] [CrossRef] [EDP Sciences] [Google Scholar]
- Jerabkova, T., Beccari, G., Boffin, H. M. J., et al. 2019, A&A, 627, A57 [NASA ADS] [CrossRef] [EDP Sciences] [Google Scholar]
- Jiménez-Serra, I., Martín-Pintado, J., Rodríguez-Franco, A., & Martín, S., 2005, ApJ, 627, L121 [Google Scholar]
- Jiménez-Serra, I., Caselli, P., Tan, J. C., et al. 2010, MNRAS, 406, 187 [Google Scholar]
- Jiménez-Serra, I., Caselli, P., Fontani, F., et al. 2014, MNRAS, 439, 1996 [Google Scholar]
- Kainulainen, J., & Tan, J. C., 2013, A&A, 549, A53 [NASA ADS] [CrossRef] [EDP Sciences] [Google Scholar]
- Kauffmann, J., Pillai, T., Shetty, R., Myers, P. C., & Goodman, A. A., 2010, ApJ, 716, 433 [NASA ADS] [CrossRef] [Google Scholar]
- Khullar, S., Matzner, C. D., Murray, N., et al. 2024, ApJ, 973, 40 [NASA ADS] [CrossRef] [Google Scholar]
- Kim, W. J., Urquhart, J. S., Veena, V. S., et al. 2023, A&A, 679, A123 [NASA ADS] [CrossRef] [EDP Sciences] [Google Scholar]
- Kinoshita, S. W., Nakamura, F., & Wu, B., 2021, ApJ, 921, 150 [NASA ADS] [CrossRef] [Google Scholar]
- Kohno, M., Yamada, R. I., Tachihara, K., et al. 2025, AJ, 169, 181 [Google Scholar]
- Liu, M., Tan, J. C., Cheng, Y., & Kong, S. 2018a, ApJ, 862, 105 [CrossRef] [Google Scholar]
- Liu, T., Li, P. S., Juvela, M., et al. 2018b, ApJ, 859, 151 [NASA ADS] [CrossRef] [Google Scholar]
- Liu, M., Tan, J. C., Marvil, J., et al. 2020, arXiv e-prints [arXiv:2010.11294] [Google Scholar]
- Liu, R., Liu, T., Jiménez-Serra, I., et al. 2025, MNRAS, 536, 1894 [Google Scholar]
- López-Sepulcre, A., Codella, C., Cesaroni, R., Marcelino, N., & Walmsley, C. M., 2009, A&A, 499, 811 [NASA ADS] [CrossRef] [EDP Sciences] [Google Scholar]
- Ma, Y., Zhou, J., Esimbek, J., et al. 2022, A&A, 663, A97 [NASA ADS] [CrossRef] [EDP Sciences] [Google Scholar]
- Martin-Pintado, J., Bachiller, R., & Fuente, A., 1992, A&A, 254, 315 [NASA ADS] [Google Scholar]
- Milam, S. N., Savage, C., Brewster, M. A., Ziurys, L. M., & Wyckoff, S., 2005, ApJ, 634, 1126 [Google Scholar]
- Moser, E., Liu, M., Tan, J. C., et al. 2020, ApJ, 897, 136 [NASA ADS] [CrossRef] [Google Scholar]
- Nakamura, F., Miura, T., Kitamura, Y., et al. 2012, ApJ, 746, 25 [NASA ADS] [CrossRef] [Google Scholar]
- Nath, B. B., Laskar, T., & Shull, J. M., 2008, ApJ, 682, 1055 [NASA ADS] [CrossRef] [Google Scholar]
- Nguyen Luong, Q., Motte, F., Hennemann, M., et al. 2011, A&A, 535, A76 [NASA ADS] [CrossRef] [EDP Sciences] [Google Scholar]
- Paredes, J. M., Ishwara-Chandra, C. H., Bosch-Ramon, V., et al. 2014, A&A, 561, A56 [NASA ADS] [CrossRef] [EDP Sciences] [Google Scholar]
- Park, J., & Ryu, D., 2019, ApJ, 875, 2 [NASA ADS] [CrossRef] [Google Scholar]
- Perault, M., Omont, A., Simon, G., et al. 1996, A&A, 315, L165 [NASA ADS] [Google Scholar]
- Pillai, T., Wyrowski, F., Carey, S. J., & Menten, K. M., 2006, A&A, 450, 569 [NASA ADS] [CrossRef] [EDP Sciences] [Google Scholar]
- Priestley, F. D., & Whitworth, A. P., 2021, MNRAS, 506, 775 [NASA ADS] [CrossRef] [Google Scholar]
- Ranasinghe, S., & Leahy, D., 2023, ApJS, 265, 53 [NASA ADS] [CrossRef] [Google Scholar]
- Rathborne, J. M., Jackson, J. M., & Simon, R., 2006, ApJ, 641, 389 [Google Scholar]
- Reach, W. T., Tram, L. N., Richter, M., Gusdorf, A., & DeWitt, C., 2019, ApJ, 884, 81 [NASA ADS] [CrossRef] [Google Scholar]
- Reach, W. T., Tram, L. N., DeWitt, C., et al. 2024, ApJ, 977, 149 [Google Scholar]
- Rico-Villas, F., Martín-Pintado, J., González-Alfonso, E., Martín, S., & Rivilla, V. M., 2020, MNRAS, 491, 4573 [NASA ADS] [CrossRef] [Google Scholar]
- Sashida, T., Oka, T., Tanaka, K., et al. 2013, ApJ, 774, 10 [NASA ADS] [CrossRef] [Google Scholar]
- Schilke, P., Walmsley, C. M., Pineau des Forets, G., & Flower, D. R. 1997, A&A, 321, 293 [NASA ADS] [Google Scholar]
- Shen, X., Liu, H.-L., Ren, Z., et al. 2024, ApJ, 974, 239 [Google Scholar]
- Simon, R., Rathborne, J. M., Shah, R. Y., Jackson, J. M., & Chambers, E. T., 2006, ApJ, 653, 1325 [NASA ADS] [CrossRef] [Google Scholar]
- Sokolov, V., Wang, K., Pineda, J. E., et al. 2017, A&A, 606, A133 [NASA ADS] [CrossRef] [EDP Sciences] [Google Scholar]
- Tan, J. C., 2000, ApJ, 536, 173 [NASA ADS] [CrossRef] [Google Scholar]
- Tan, J. C., Beltrán, M. T., Caselli, P., et al. 2014, in Protostars and Planets VI, eds. H. Beuther, R. S. Klessen, C. P. Dullemond, & T. Henning (Tucson: University of Arizona Press), 149 [Google Scholar]
- Tasker, E. J., & Tan, J. C., 2009, ApJ, 700, 358 [NASA ADS] [CrossRef] [Google Scholar]
- Tokuda, K., Fukui, Y., Harada, R., et al. 2019, ApJ, 886, 15 [NASA ADS] [CrossRef] [Google Scholar]
- Tsujimoto, S., Oka, T., Takekawa, S., et al. 2018, ApJ, 856, 91 [Google Scholar]
- van der Tak, F. F. S., Black, J. H., Schöier, F. L., Jansen, D. J., & van Dishoeck, E. F., 2007, A&A, 468, 627 [NASA ADS] [CrossRef] [EDP Sciences] [Google Scholar]
- van Dishoeck, E. F., Jansen, D. J., & Phillips, T. G., 1993, A&A, 279, 541 [NASA ADS] [Google Scholar]
- Watson, C., Araya, E., Sewilo, M., et al. 2003, ApJ, 587, 714 [Google Scholar]
- Wootten, A., 1978, Moon Planets, 19, 163 [CrossRef] [Google Scholar]
- Wu, B., Tan, J. C., Nakamura, F., et al. 2017, ApJ, 835, 137 [NASA ADS] [CrossRef] [Google Scholar]
- Wu, B., Tan, J. C., Christie, D., & Nakamura, F., 2020, ApJ, 891, 168 [Google Scholar]
- Yamada, M., Oka, T., Takekawa, S., et al. 2017, ApJ, 834, L3 [Google Scholar]
- Zeng, S., Zhang, Q., Jiménez-Serra, I., et al. 2020, MNRAS, 497, 4896 [NASA ADS] [CrossRef] [Google Scholar]
- Zhang, Q., Hunter, T. R., Brand, J., et al. 2005, ApJ, 625, 864 [NASA ADS] [CrossRef] [Google Scholar]
The spectral index has been estimated as α=log(F1/F2)/log(v1/v2). Where F1, v1 and F2, v2 are the flux in Jy and frequency in MHz of the Meerkat and GMRT data, respectively.
All Figures
|
Fig. 1 Middle: SiO(2−1) integrated intensity map (black contours) obtained towards the velocity range 38−50 km s−1. The emission contours, from 3σ(σ=0.07 K km s−1) by steps of 3σ, are superimposed on the mass surface density map (colour scale) obtained by Kainulainen & Tan (2013). The beam size and spatial scale are indicated in the bottom right and top left corners of the map, respectively. The location of the massive cores within the cloud is indicated with light green crosses (Rathborne et al. 2006; Butler & Tan 2012). The yellow circles, labelled from A to F, indicate the positions used to extract the SiO spectra. The dashed pink square separates the northern and southern parts of the cloud. Right and left: SiO(2−1) spectra extracted towards the six positions from A to F and using an aperture of 28′′, the size of the beam of the IRAM 30 m telescope at the frequency of the SiO(2−1) line. In each panel, the cloud velocity (vLSR=45.5 km s−1 Hernandez & Tan 2015) is indicated by a vertical dashed magenta line. |
| In the text | |
|
Fig. 2 Left: H13 CO+(1−0) integrated intensity map (colour scale) obtained towards the velocity range 42−48 km s−1. The zero level of the colour bar corresponds to 3σ(σ=0.1 K km s−1). The yellow line indicates the path used to extract the pv diagrams shown in Fig. 3. Along this curve, the intermediate endpoints are marked as A0 and A1. The beam size is indicated in the bottom right of the map. The location of the massive cores within the cloud is indicated with light green crosses (Rathborne et al. 2006; Butler & Tan 2012). Right: velocity map (colour scale) of the H13 CO+(1−0) emission with the dense gas tracer and mass surface density emission contours superimposed as in the left panel. Only pixels with an integrated intensity above 3σ are shown. The north and east directions are indicated in the bottom right corner. In both panels, the SiO emission contours, from 3σ(σ=0.07 K km s−1) by steps of 3σ, and the 0.1 g cm−2 mass surface density contour (visual extinction ∼20 mag) are superimposed (Kainulainen & Tan 2013). |
| In the text | |
|
Fig. 3 Position-velocity (pv) diagram of the H13 CO+emission (colour scale) extracted across the yellow curve seen in the left panel of Fig. 2. The vertical dashed yellow lines correspond to the endpoints A0 and A1 indicated in Fig. 2. The white contours corresponds to the SiO pv diagram extracted along the same curve from 3σ (σ=0.03 K) by steps of 3σ. |
| In the text | |
|
Fig. 4 1.3 GHz emission (colour scale) image obtained with MeerKat (Goedhart et al. 2024) towards G035.39 and its surroundings. The yellow contours corresponds to 0.1 g cm−2 in the mass surface density map of Kainulainen & Tan (2013) and highlights the shape and location of the IRDC. The white contour corresponds to the 3σ(σ=0.0004) emission level in the GMRT image at 610 MHz from Paredes et al. (2014). The dashed red circle indicates the location of the putative bubble. |
| In the text | |
|
Fig. 5 1.3 GHz emission (colour scale) image obtained with MeerKat (Goedhart et al. 2024) towards G035.39. The yellow contours corresponds to 0.1 g cm−2 in the mass surface density map of Kainulainen & Tan (2013) and highlights the shape and location of the IRDC. The white (44–45.5 km s−1) and orange (45.5−46.5 km s−1) shadows correspond to the integrated intensity maps of the 13 CO(1−0) (left panel) and C18 O(1−0) emission (right panel) obtained with the Green Bank Telescope 100 m antenna. The orange shadows correspond to integrated emission larger than 3σ for both the 13 CO(σ=0.4 K km s−1) and C18 O emission (σ=0.15 km s−1). The white shadows correspond to integrated emission larger than 6σ for the 13 CO emission (σ=0.5 K km s−1) and 3σ for the C18 O emission (σ=0.17 km s−1). |
| In the text | |
|
Fig. 6 Pv diagram obtained by collapsing the 13CO(1-0) (colour scale) and H13 CO+(1-0) (white contours) cubes along the declination axis. H13CO+contours are from 3σ(σ=0.015 K) in steps of 3σ. |
| In the text | |
Current usage metrics show cumulative count of Article Views (full-text article views including HTML views, PDF and ePub downloads, according to the available data) and Abstracts Views on Vision4Press platform.
Data correspond to usage on the plateform after 2015. The current usage metrics is available 48-96 hours after online publication and is updated daily on week days.
Initial download of the metrics may take a while.