Fig. 2
Download original image
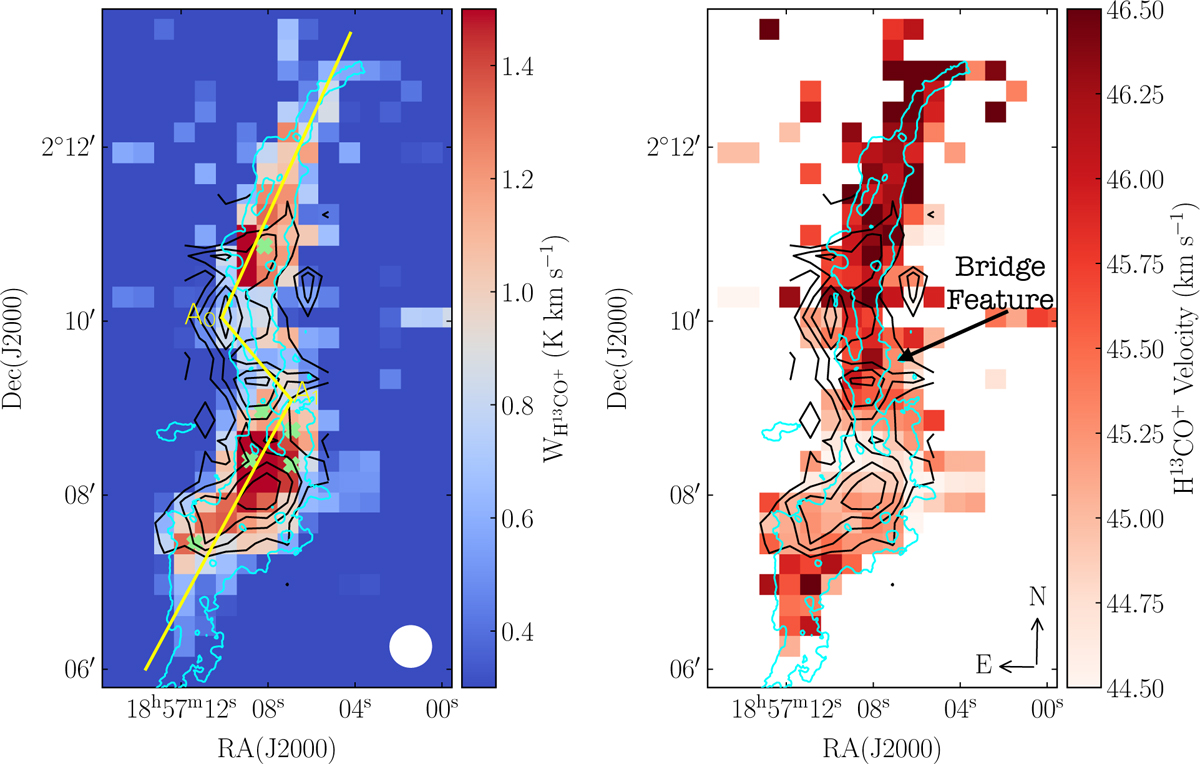
Left: H13 CO+(1−0) integrated intensity map (colour scale) obtained towards the velocity range 42−48 km s−1. The zero level of the colour bar corresponds to 3σ(σ=0.1 K km s−1). The yellow line indicates the path used to extract the pv diagrams shown in Fig. 3. Along this curve, the intermediate endpoints are marked as A0 and A1. The beam size is indicated in the bottom right of the map. The location of the massive cores within the cloud is indicated with light green crosses (Rathborne et al. 2006; Butler & Tan 2012). Right: velocity map (colour scale) of the H13 CO+(1−0) emission with the dense gas tracer and mass surface density emission contours superimposed as in the left panel. Only pixels with an integrated intensity above 3σ are shown. The north and east directions are indicated in the bottom right corner. In both panels, the SiO emission contours, from 3σ(σ=0.07 K km s−1) by steps of 3σ, and the 0.1 g cm−2 mass surface density contour (visual extinction ∼20 mag) are superimposed (Kainulainen & Tan 2013).
Current usage metrics show cumulative count of Article Views (full-text article views including HTML views, PDF and ePub downloads, according to the available data) and Abstracts Views on Vision4Press platform.
Data correspond to usage on the plateform after 2015. The current usage metrics is available 48-96 hours after online publication and is updated daily on week days.
Initial download of the metrics may take a while.