Fig. 3
Download original image
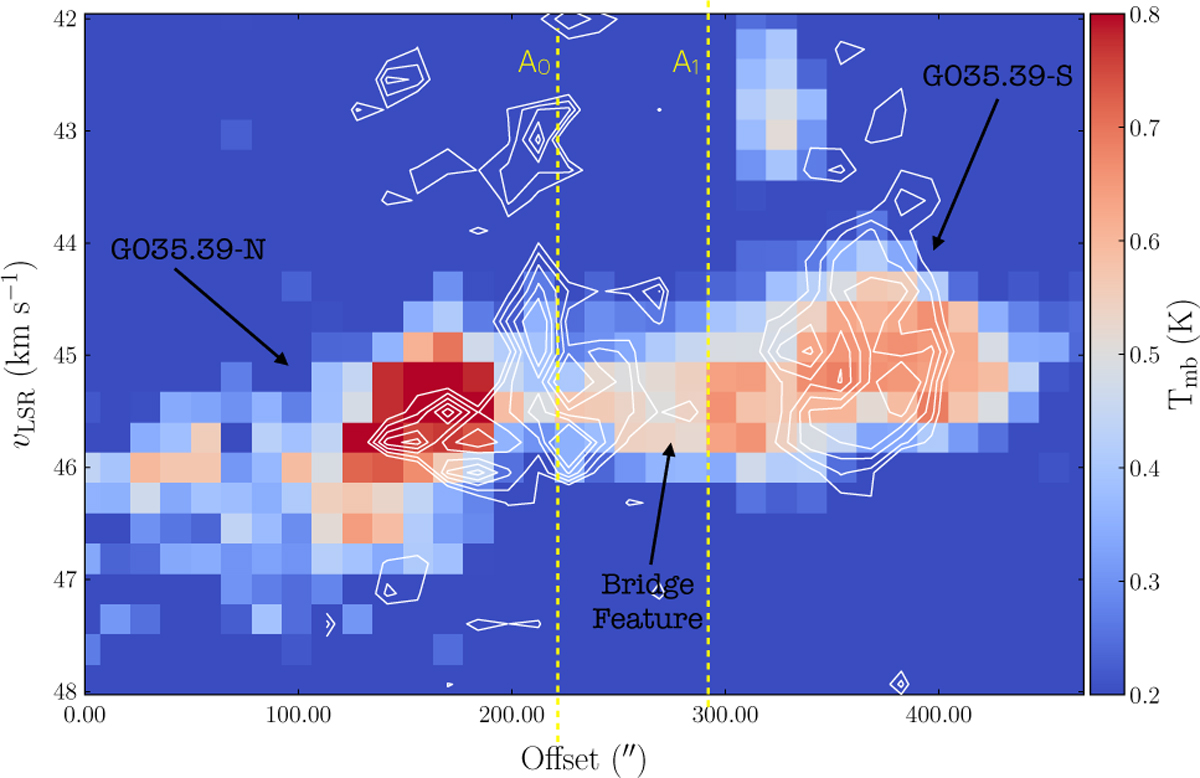
Position-velocity (pv) diagram of the H13 CO+emission (colour scale) extracted across the yellow curve seen in the left panel of Fig. 2. The vertical dashed yellow lines correspond to the endpoints A0 and A1 indicated in Fig. 2. The white contours corresponds to the SiO pv diagram extracted along the same curve from 3σ (σ=0.03 K) by steps of 3σ.
Current usage metrics show cumulative count of Article Views (full-text article views including HTML views, PDF and ePub downloads, according to the available data) and Abstracts Views on Vision4Press platform.
Data correspond to usage on the plateform after 2015. The current usage metrics is available 48-96 hours after online publication and is updated daily on week days.
Initial download of the metrics may take a while.