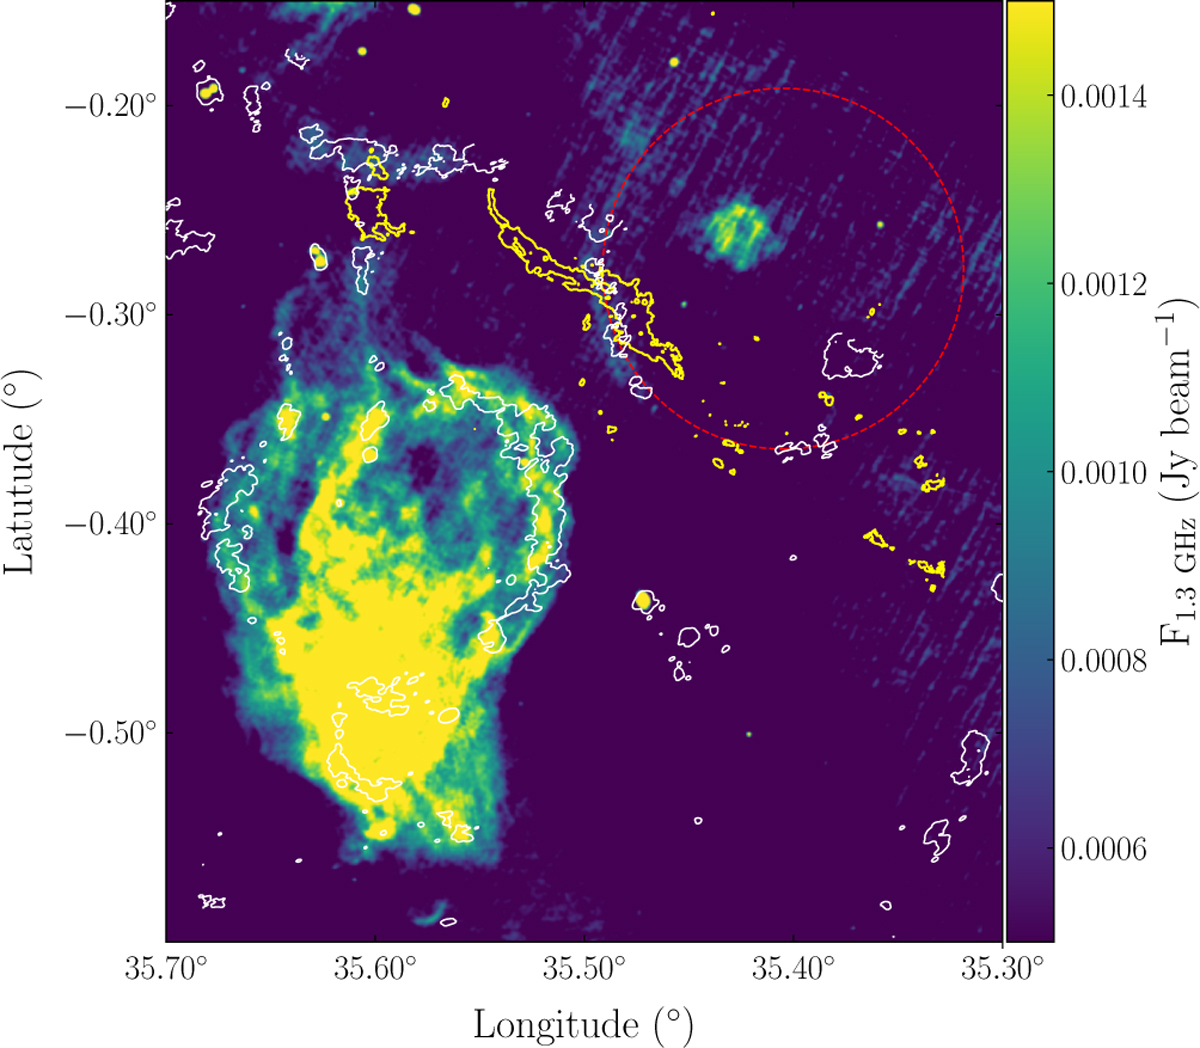
Fig. 4
Download original image
1.3 GHz emission (colour scale) image obtained with MeerKat (Goedhart et al. 2024) towards G035.39 and its surroundings. The yellow contours corresponds to 0.1 g cm−2 in the mass surface density map of Kainulainen & Tan (2013) and highlights the shape and location of the IRDC. The white contour corresponds to the 3σ(σ=0.0004) emission level in the GMRT image at 610 MHz from Paredes et al. (2014). The dashed red circle indicates the location of the putative bubble.
Current usage metrics show cumulative count of Article Views (full-text article views including HTML views, PDF and ePub downloads, according to the available data) and Abstracts Views on Vision4Press platform.
Data correspond to usage on the plateform after 2015. The current usage metrics is available 48-96 hours after online publication and is updated daily on week days.
Initial download of the metrics may take a while.