Fig. 5
Download original image
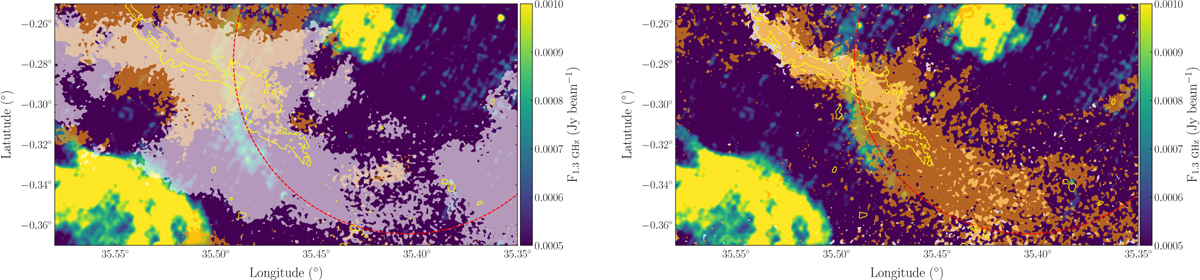
1.3 GHz emission (colour scale) image obtained with MeerKat (Goedhart et al. 2024) towards G035.39. The yellow contours corresponds to 0.1 g cm−2 in the mass surface density map of Kainulainen & Tan (2013) and highlights the shape and location of the IRDC. The white (44–45.5 km s−1) and orange (45.5−46.5 km s−1) shadows correspond to the integrated intensity maps of the 13 CO(1−0) (left panel) and C18 O(1−0) emission (right panel) obtained with the Green Bank Telescope 100 m antenna. The orange shadows correspond to integrated emission larger than 3σ for both the 13 CO(σ=0.4 K km s−1) and C18 O emission (σ=0.15 km s−1). The white shadows correspond to integrated emission larger than 6σ for the 13 CO emission (σ=0.5 K km s−1) and 3σ for the C18 O emission (σ=0.17 km s−1).
Current usage metrics show cumulative count of Article Views (full-text article views including HTML views, PDF and ePub downloads, according to the available data) and Abstracts Views on Vision4Press platform.
Data correspond to usage on the plateform after 2015. The current usage metrics is available 48-96 hours after online publication and is updated daily on week days.
Initial download of the metrics may take a while.