Open Access
Fig. 6
Download original image
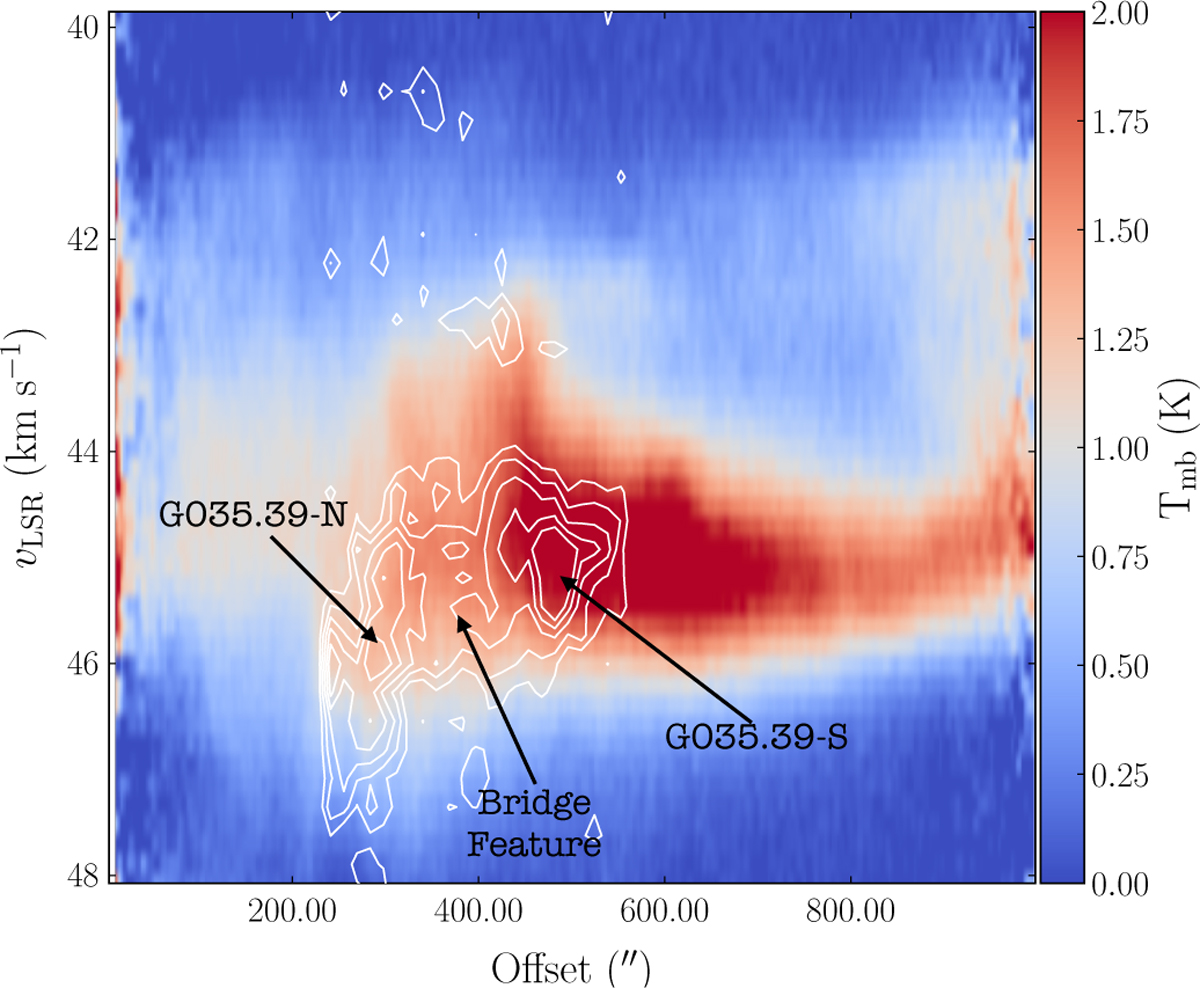
Pv diagram obtained by collapsing the 13CO(1-0) (colour scale) and H13 CO+(1-0) (white contours) cubes along the declination axis. H13CO+contours are from 3σ(σ=0.015 K) in steps of 3σ.
Current usage metrics show cumulative count of Article Views (full-text article views including HTML views, PDF and ePub downloads, according to the available data) and Abstracts Views on Vision4Press platform.
Data correspond to usage on the plateform after 2015. The current usage metrics is available 48-96 hours after online publication and is updated daily on week days.
Initial download of the metrics may take a while.