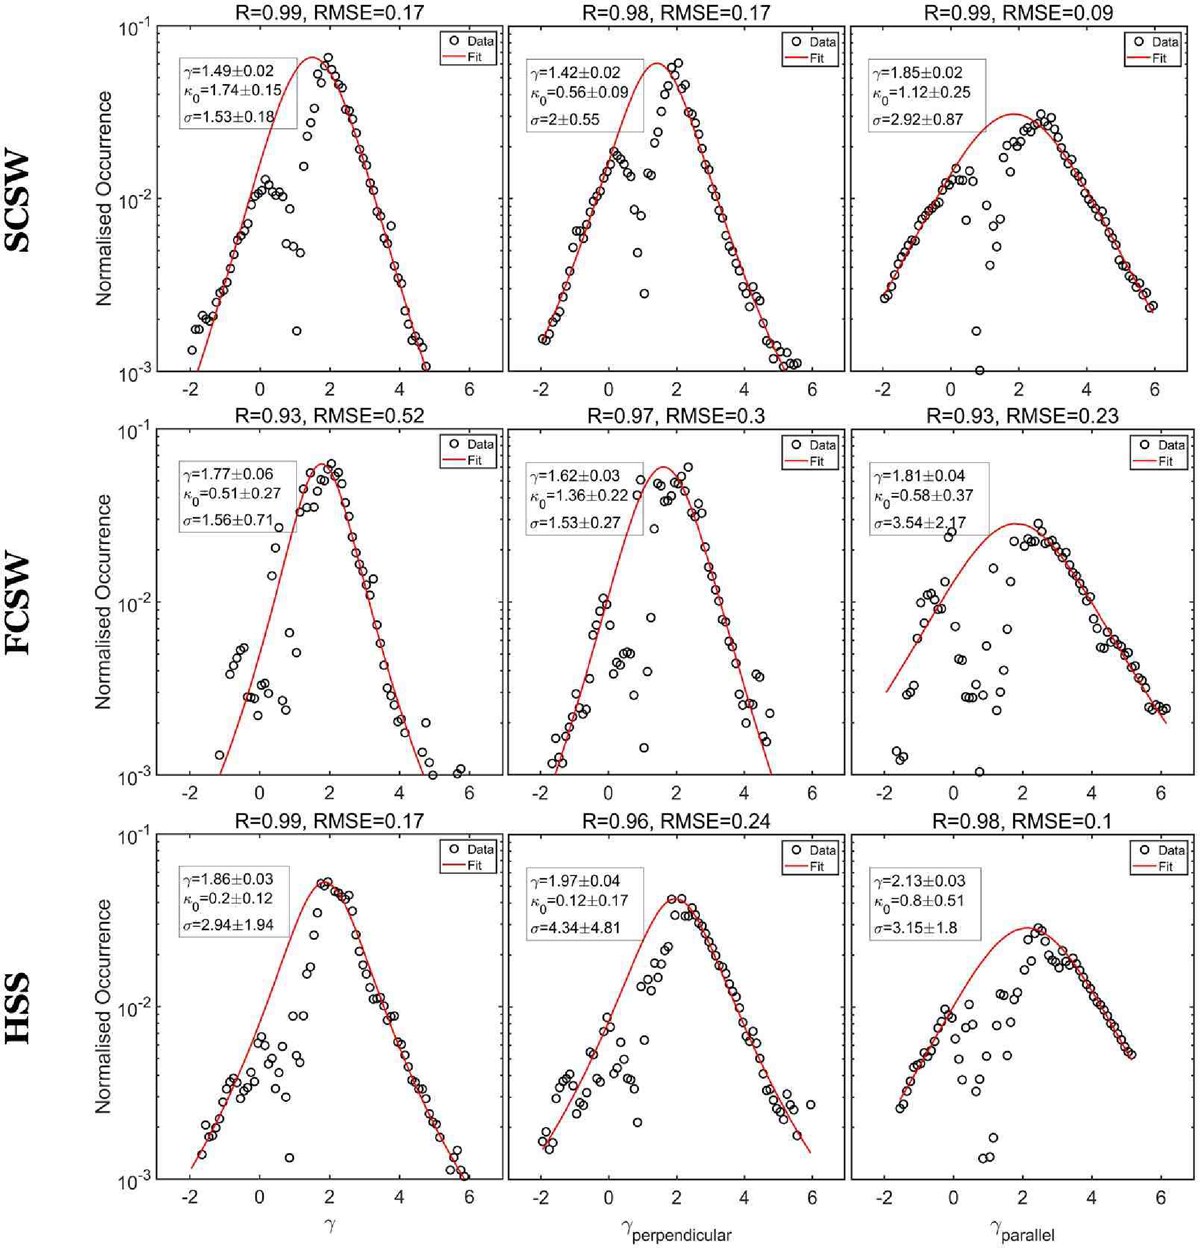
Fig. 1.
Download original image
Histograms of the normalised occurrence (black circles) and κ-Gaussian distributions (red lines) of the (from left to right) total, perpendicular, and parallel γ. From top to bottom: SCSW, FCSW, and HSS for all the SIR events on our list. The Pearson R and the root mean square error (RMSE) of the fitted κ-Gaussian versus the normalised histogram values are shown at the top of each panel.
Current usage metrics show cumulative count of Article Views (full-text article views including HTML views, PDF and ePub downloads, according to the available data) and Abstracts Views on Vision4Press platform.
Data correspond to usage on the plateform after 2015. The current usage metrics is available 48-96 hours after online publication and is updated daily on week days.
Initial download of the metrics may take a while.