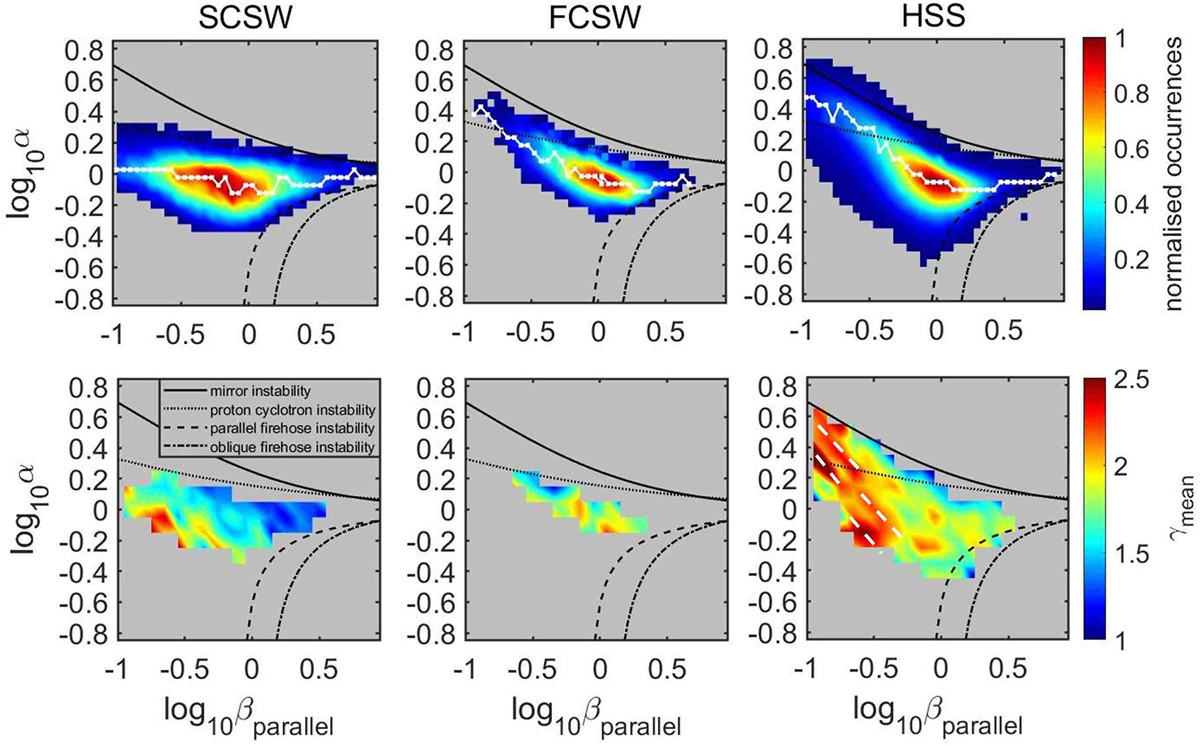
Fig. 4.
Download original image
Two-dimensional histograms of the temperature anisotropy with respect to the parallel plasma β (β∥) for the SCSW (left), FCSW (middle), and HSS (right). Overplotted are the mirror (solid lines), proton cyclotron (dotted lines), parallel (dashed lines), and oblique (dot-dashed lines) fire hose instabilities assuming a maximum growth rate of 10−3 (Hellinger et al. 2006). The dotted white line in the top panels corresponds to the most frequent value in each log10(β); the normalised occurrence in each bin is colour-coded, with red corresponding to 1. The bottom panels correspond to the distribution of the effective total ![]() in each log10(α)–log10(β∥) bin. The near-diagonal dashed white lines in the bottom-right panel highlight the clusters with significantly increased
in each log10(α)–log10(β∥) bin. The near-diagonal dashed white lines in the bottom-right panel highlight the clusters with significantly increased ![]() .
.
Current usage metrics show cumulative count of Article Views (full-text article views including HTML views, PDF and ePub downloads, according to the available data) and Abstracts Views on Vision4Press platform.
Data correspond to usage on the plateform after 2015. The current usage metrics is available 48-96 hours after online publication and is updated daily on week days.
Initial download of the metrics may take a while.