Fig. 4
Download original image
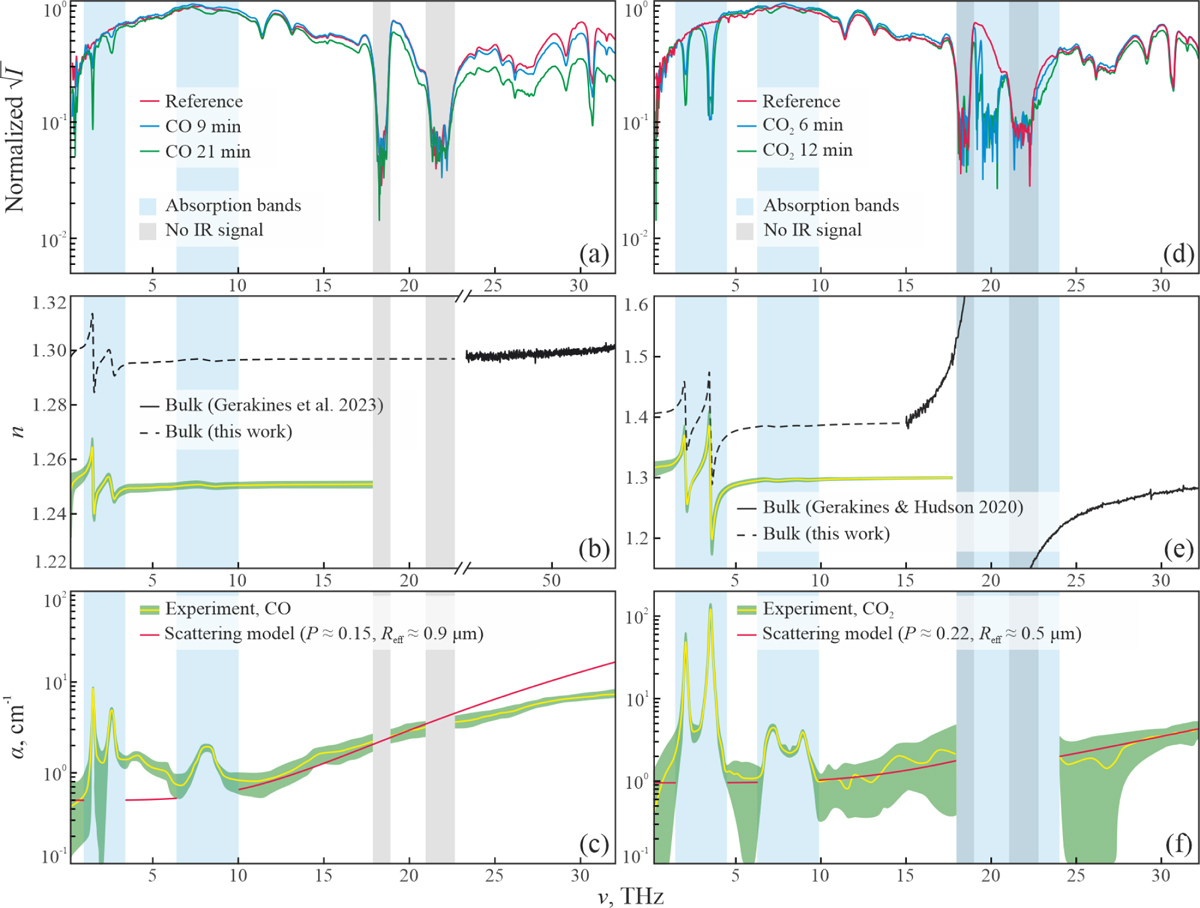
THz-IR optical properties of the studied CO and CO2 ices along with the estimates of scattering parameters. Panel a: examples of the reference and sample IR signals for CO ices. The blue-shaded stripes indicate the absorption bands, and the gray-shaded stripes the ranges of low IR signal. Panels b and c: refractive index (n) and absorption coefficient (α; by field, plotted in log scale) of our CO ices. We show the mean value (solid yellow lines) with the ±1.5σ confidence interval (green shading) for the measurements, as well as the calibrated value for n (dashed black line). The results overlap with the literature data for high-frequency n of compact CO ice from Gerakines et al. (2023), and with the modeled scattering coefficient µs/2, corresponding to P ≈ 15% and Reff ≈ 0.9 µm. Panels d–f: same but for CO2 ices. Here µs/2 corresponds to P ≈ 22% and Reff ≈ 0.5 µm, and the literature data for compact CO2 ice are taken from Gerakines & Hudson (2020).
Current usage metrics show cumulative count of Article Views (full-text article views including HTML views, PDF and ePub downloads, according to the available data) and Abstracts Views on Vision4Press platform.
Data correspond to usage on the plateform after 2015. The current usage metrics is available 48-96 hours after online publication and is updated daily on week days.
Initial download of the metrics may take a while.