Fig. 5
Download original image
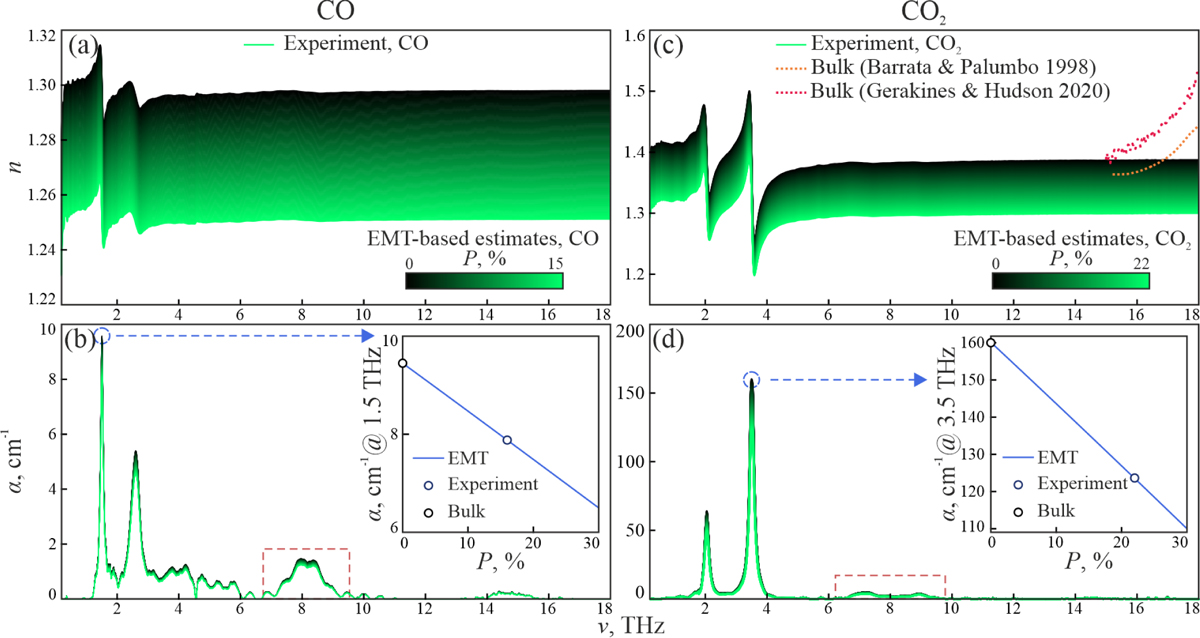
Bruggeman model-based predictions of the THz-IR optical properties of CO and CO2 ices for different values of porosity (P). Panels a and b: refractive index (n) and absorption coefficient (α; by field) of CO ice. Panels c and d: same but for CO2 ice. The inserts in panels b and d depict the maximum amplitude of α for the most intense absorption peak in CO (at 1.5 THz) and CO2 (at 3.5 THz), respectively, plotted versus P. The dashed red rectangles in panels b and d indicate the absorption peaks disappearing upon annealing (presumably caused by the morphological features of porous ice). In panel c, the estimated refractive index of compact (P = 0) CO2 ice is compared with that of reportedly compact samples (Baratta & Palumbo 1998; Gerakines & Hudson 2020).
Current usage metrics show cumulative count of Article Views (full-text article views including HTML views, PDF and ePub downloads, according to the available data) and Abstracts Views on Vision4Press platform.
Data correspond to usage on the plateform after 2015. The current usage metrics is available 48-96 hours after online publication and is updated daily on week days.
Initial download of the metrics may take a while.