Fig. 2.
Download original image
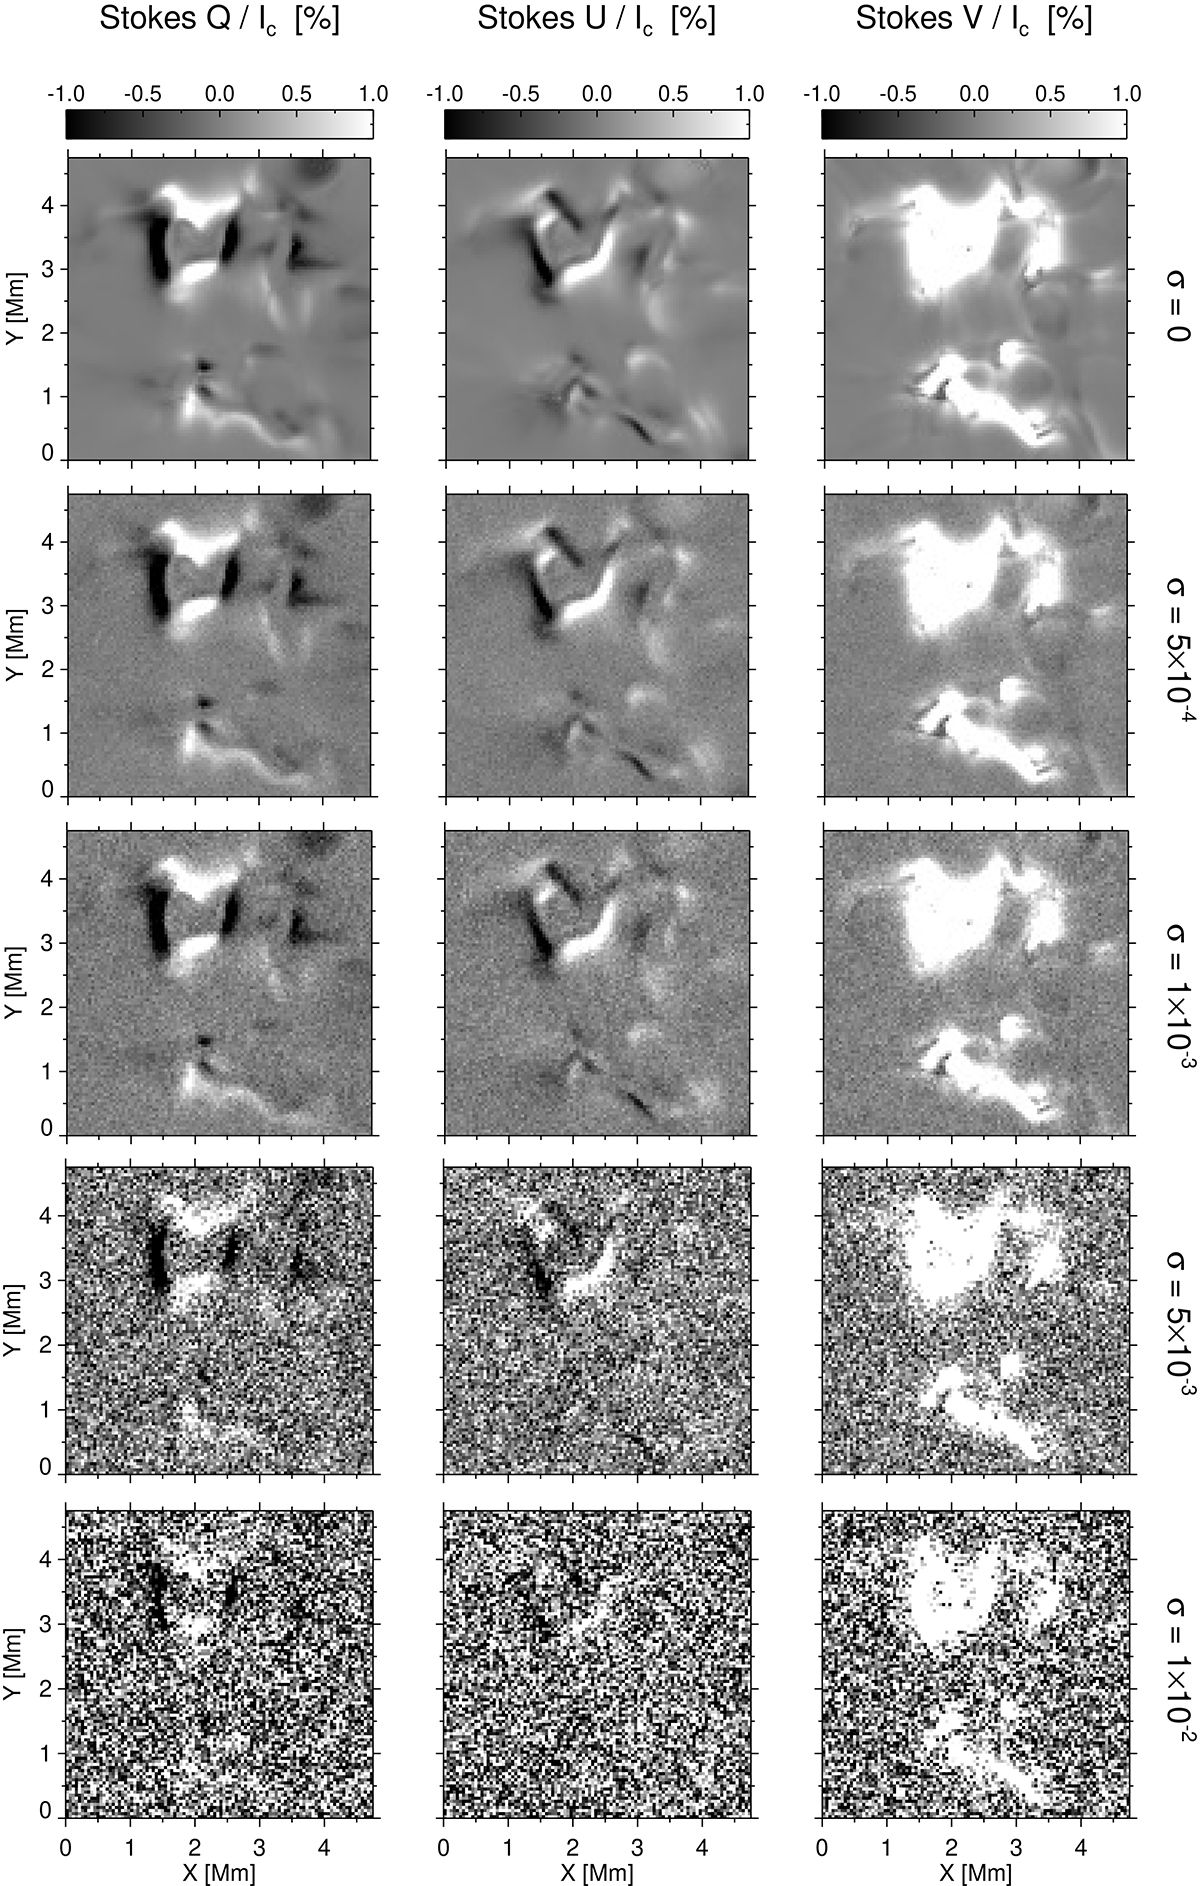
Filtergram of Stokes Q (left column), U (middle column), and V (right column) at a wavelength Δλ = −0.2 nm from the line center of the Mg I 12.32 μm line. From top to bottom: Synthetic Stokes profiles and those with a random Gaussian noise of amplitudes 5 × 10⁻⁴, 1 × 10⁻³, 5 × 10⁻³, and 1 × 10⁻² relative to the mean continuum intensity Ic, respectively.
Current usage metrics show cumulative count of Article Views (full-text article views including HTML views, PDF and ePub downloads, according to the available data) and Abstracts Views on Vision4Press platform.
Data correspond to usage on the plateform after 2015. The current usage metrics is available 48-96 hours after online publication and is updated daily on week days.
Initial download of the metrics may take a while.