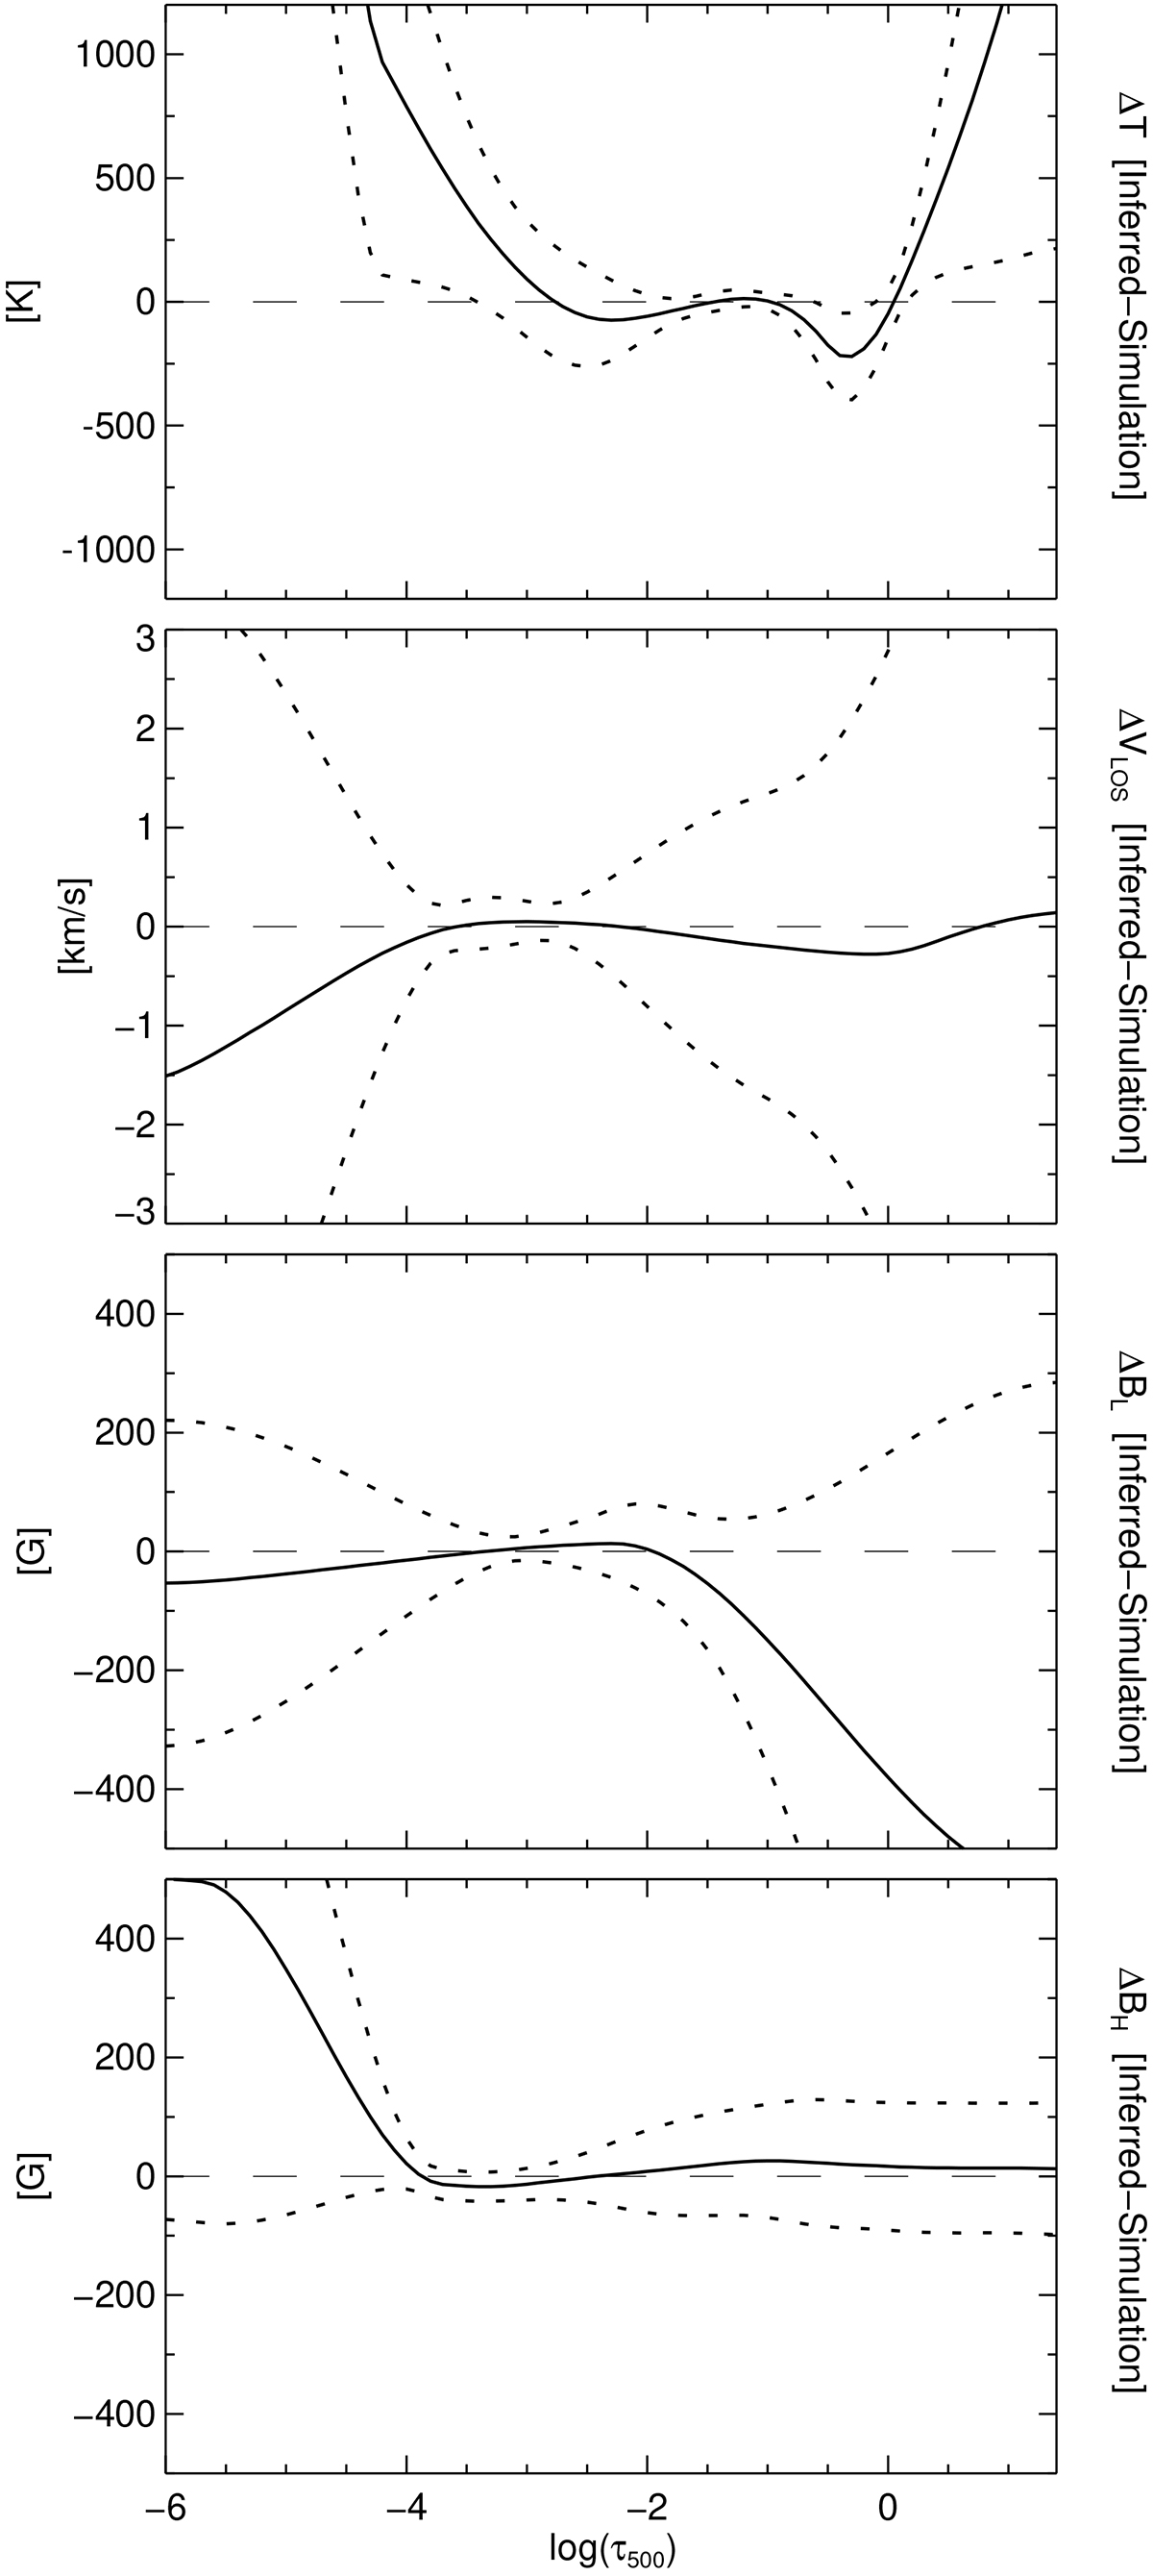
Fig. 3.
Download original image
Mean differences between the inferred atmospheric parameters and those of the simulation (solid line) as a function of the optical depth log (τ500). From top to bottom: Temperature, LOS velocity, and longitudinal and horizontal components of magnetic field. The dotted curves enclose the standard deviation of the differences.
Current usage metrics show cumulative count of Article Views (full-text article views including HTML views, PDF and ePub downloads, according to the available data) and Abstracts Views on Vision4Press platform.
Data correspond to usage on the plateform after 2015. The current usage metrics is available 48-96 hours after online publication and is updated daily on week days.
Initial download of the metrics may take a while.