Fig. 4.
Download original image
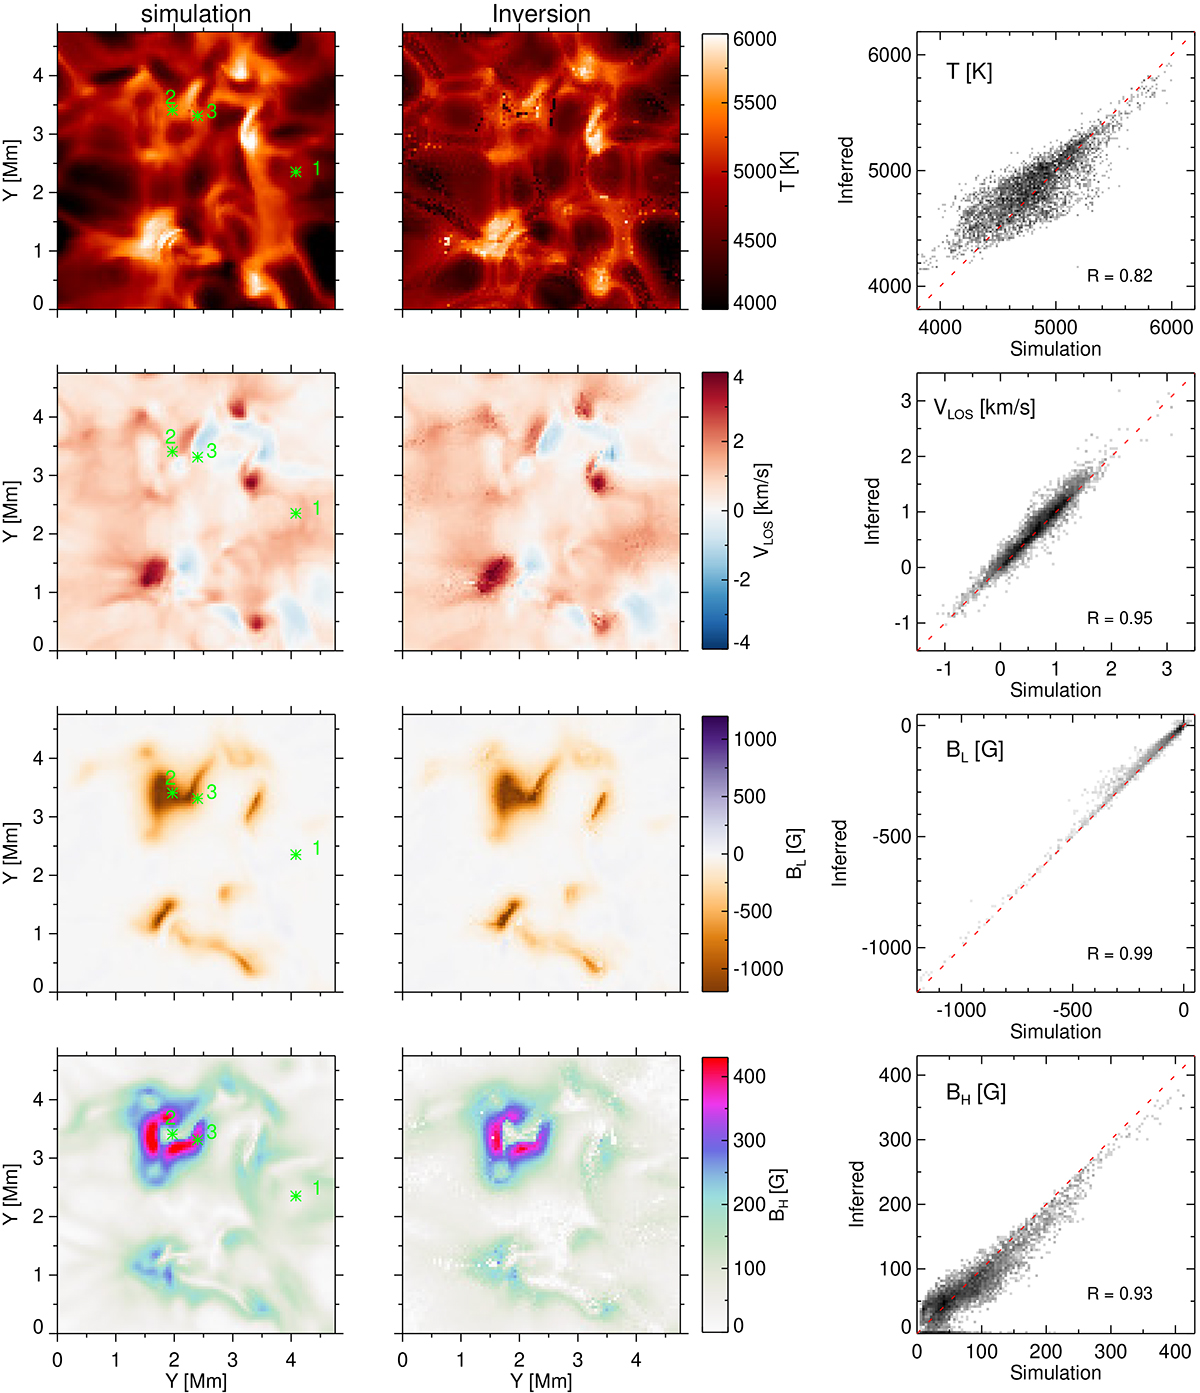
Maps (from top to bottom): Temperature, LOS velocity, and longitudinal and horizontal magnetic field components from the simulation (left column) and inversion (middle column) at optical depth of log (τ500) = − 2.9. The scatter plots of each atmospheric parameter are presented in the right column, with the Pearson correlation coefficient (r) at the bottom right, and the red dashed lines represent one-to-one correspondences. The green numbers indicate selected pixels which their Stokes profiles are displayed in this work.
Current usage metrics show cumulative count of Article Views (full-text article views including HTML views, PDF and ePub downloads, according to the available data) and Abstracts Views on Vision4Press platform.
Data correspond to usage on the plateform after 2015. The current usage metrics is available 48-96 hours after online publication and is updated daily on week days.
Initial download of the metrics may take a while.