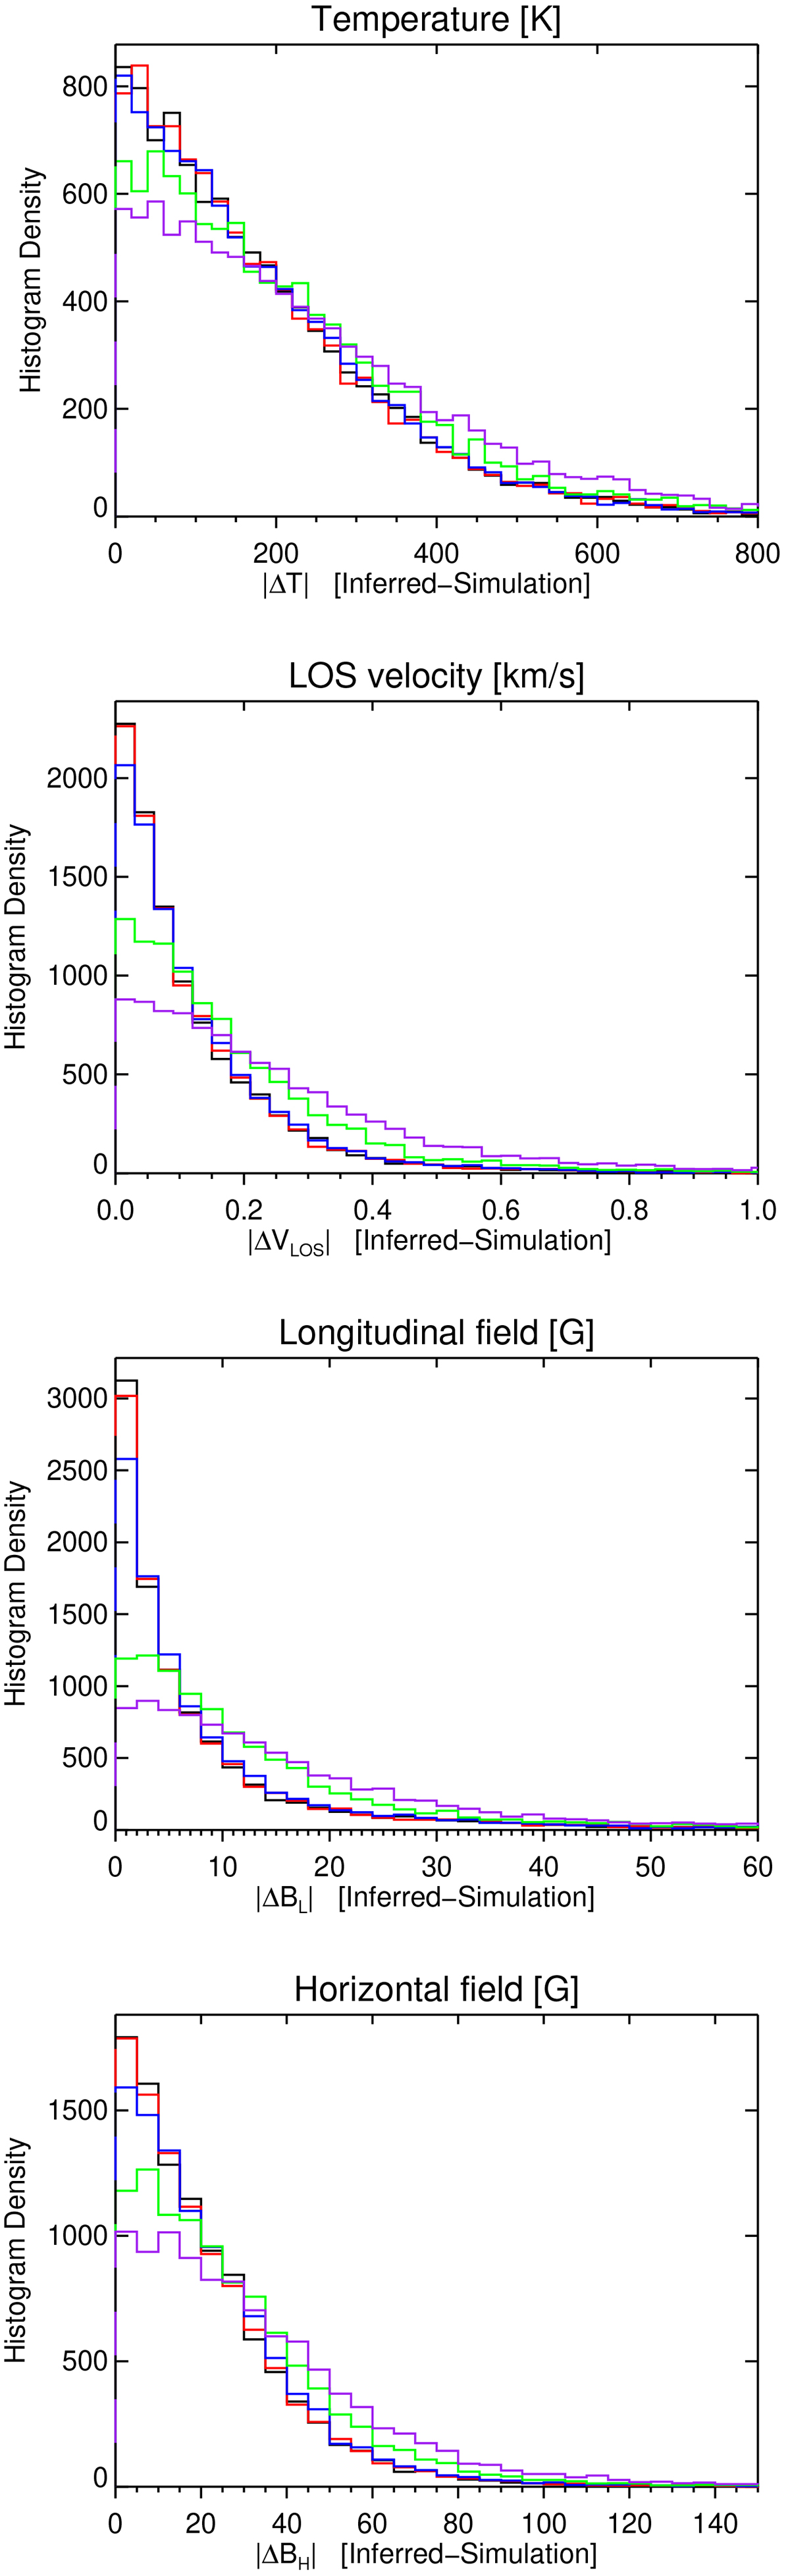
Fig. 7.
Download original image
Histograms of the absolute differences between the inferred atmospheric parameters and those of the Bifrost simulation at optical depth of log (τ500) = − 2.9. Black, red, blue, green, and purple colors correspond to the inversion results of Stoke profiles, without any noise and those with noise levels of 5 × 10⁻⁴, 1 × 10⁻³, 5 × 10⁻³, and 1 × 10⁻² of Ic, respectively.
Current usage metrics show cumulative count of Article Views (full-text article views including HTML views, PDF and ePub downloads, according to the available data) and Abstracts Views on Vision4Press platform.
Data correspond to usage on the plateform after 2015. The current usage metrics is available 48-96 hours after online publication and is updated daily on week days.
Initial download of the metrics may take a while.