Open Access
Fig. 1.
Download original image
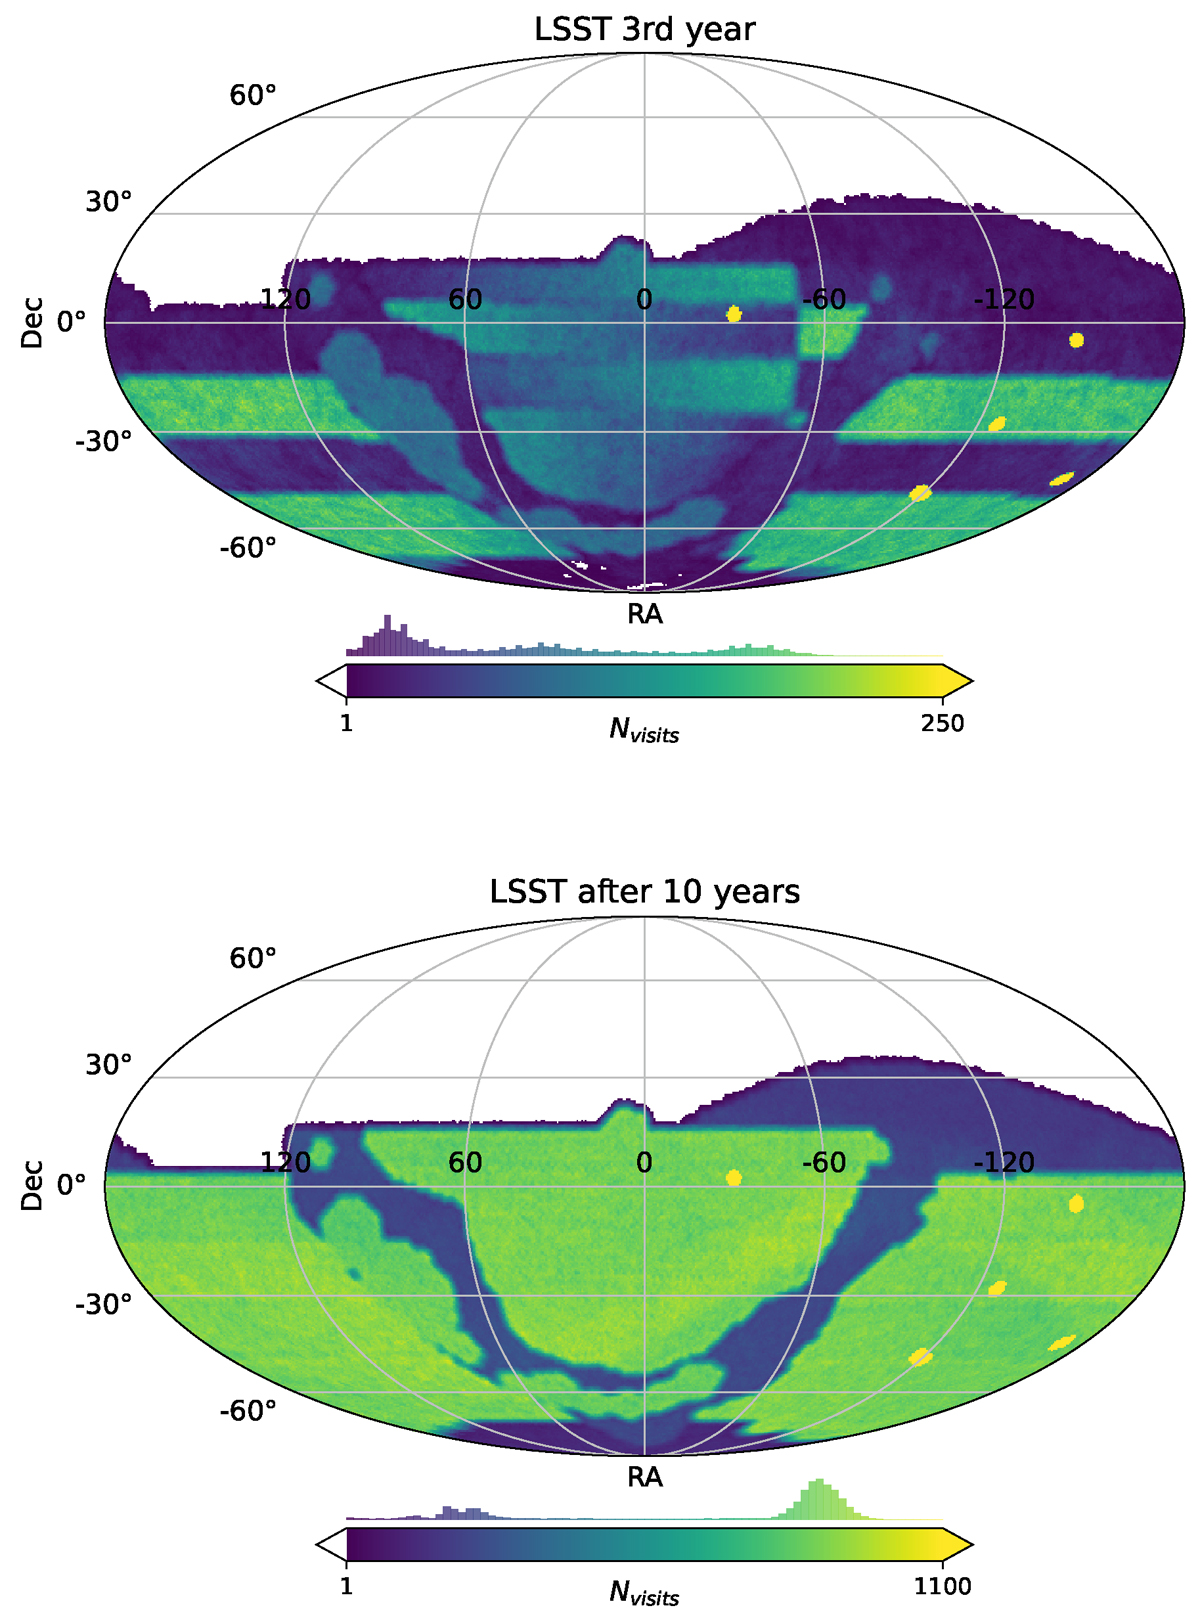
LSST survey footprint showing the number of visits (Nvisits) in each sky location. The top panel shows the visits during the third year when the rolling cadence is active, and the bottom pabnel shows the survey as expected after completion (ten years of observations).
Current usage metrics show cumulative count of Article Views (full-text article views including HTML views, PDF and ePub downloads, according to the available data) and Abstracts Views on Vision4Press platform.
Data correspond to usage on the plateform after 2015. The current usage metrics is available 48-96 hours after online publication and is updated daily on week days.
Initial download of the metrics may take a while.