Fig. 10.
Download original image
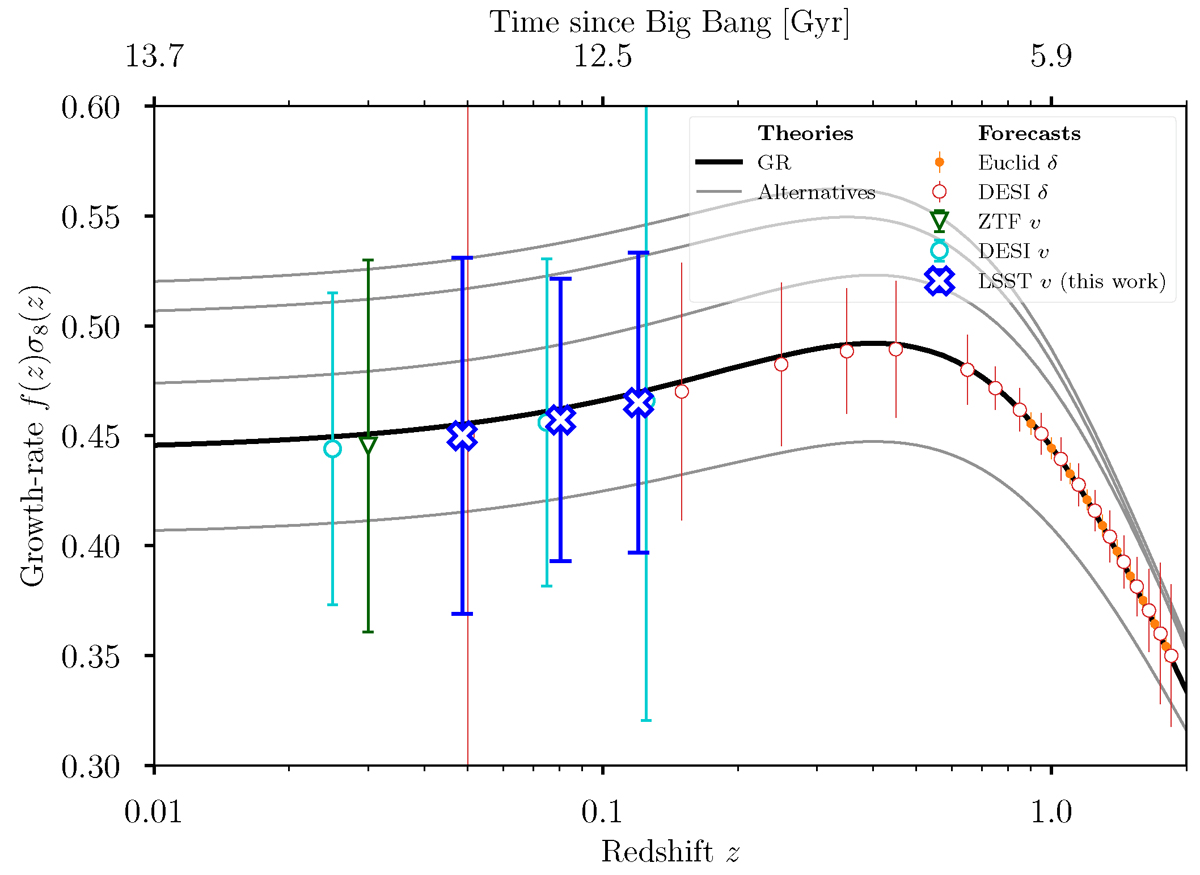
Growth-rate parameter as a function of redshift. The solid black line shows the GR-ΛCDM prediction, and the gray lines present the predictions for alternative gravity theories. The points show different forecasts for future and current stage IV surveys. The orange points show the forecast for Euclid (Amendola et al. 2018), and the red circles show those for DESI (DESI Collaboration 2016). The forecasts from DESI and Euclid are derived from the analysis of the density field. The other forecasts come from the PV field: the green triangle from ZTF SNe Ia (Carreres et al. 2023), the cyan circles from the DESI PV survey (Saulder et al. 2023), and the blue crosses from LSST SNe Ia, which are the results from the Photo-typed sample in the tomographic bins.
Current usage metrics show cumulative count of Article Views (full-text article views including HTML views, PDF and ePub downloads, according to the available data) and Abstracts Views on Vision4Press platform.
Data correspond to usage on the plateform after 2015. The current usage metrics is available 48-96 hours after online publication and is updated daily on week days.
Initial download of the metrics may take a while.