Open Access
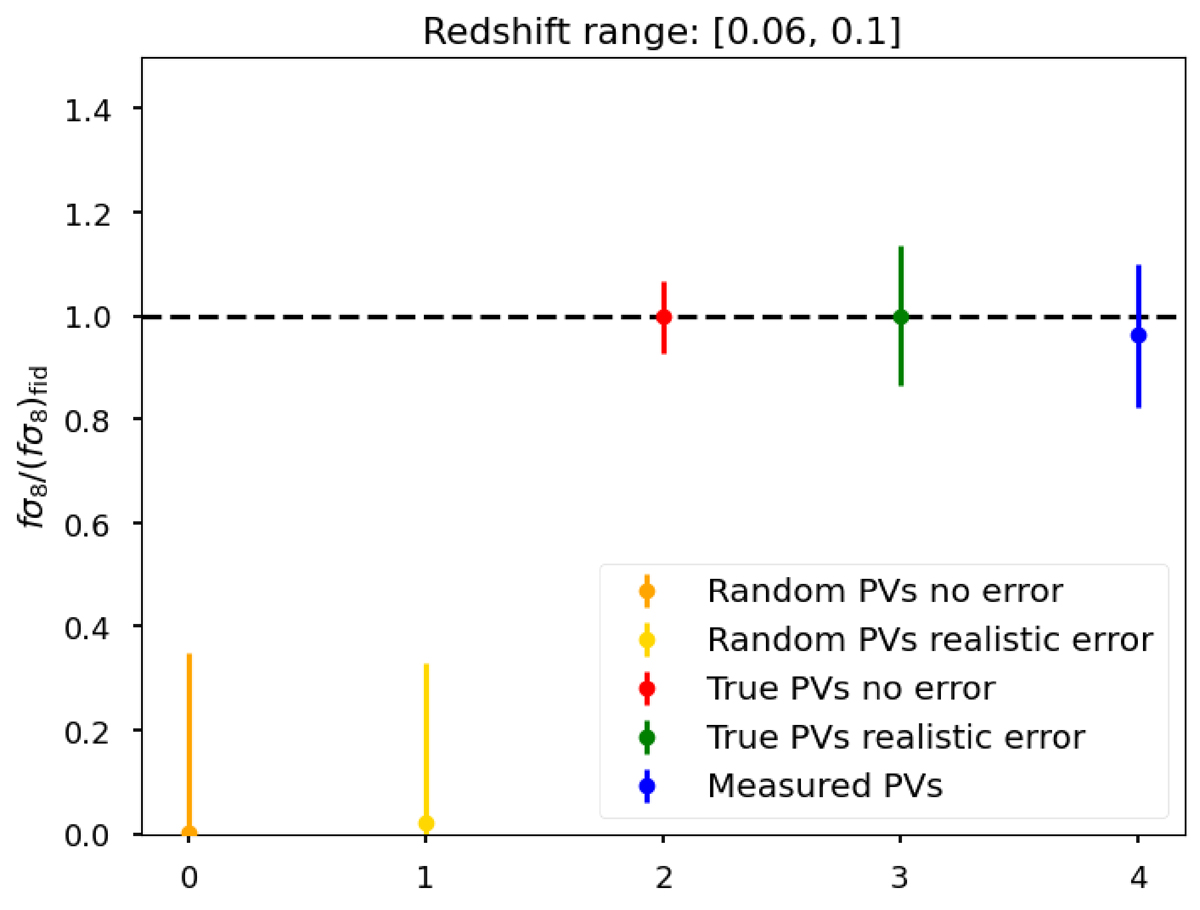
Fig. C.1.
Download original image
fσ8 results in the redshift range 0.06 < z < 0.1 for five different data vectors as defined in the legend. The colored points shows the averages over the eight LSST realizations with the average relative errors.
Current usage metrics show cumulative count of Article Views (full-text article views including HTML views, PDF and ePub downloads, according to the available data) and Abstracts Views on Vision4Press platform.
Data correspond to usage on the plateform after 2015. The current usage metrics is available 48-96 hours after online publication and is updated daily on week days.
Initial download of the metrics may take a while.