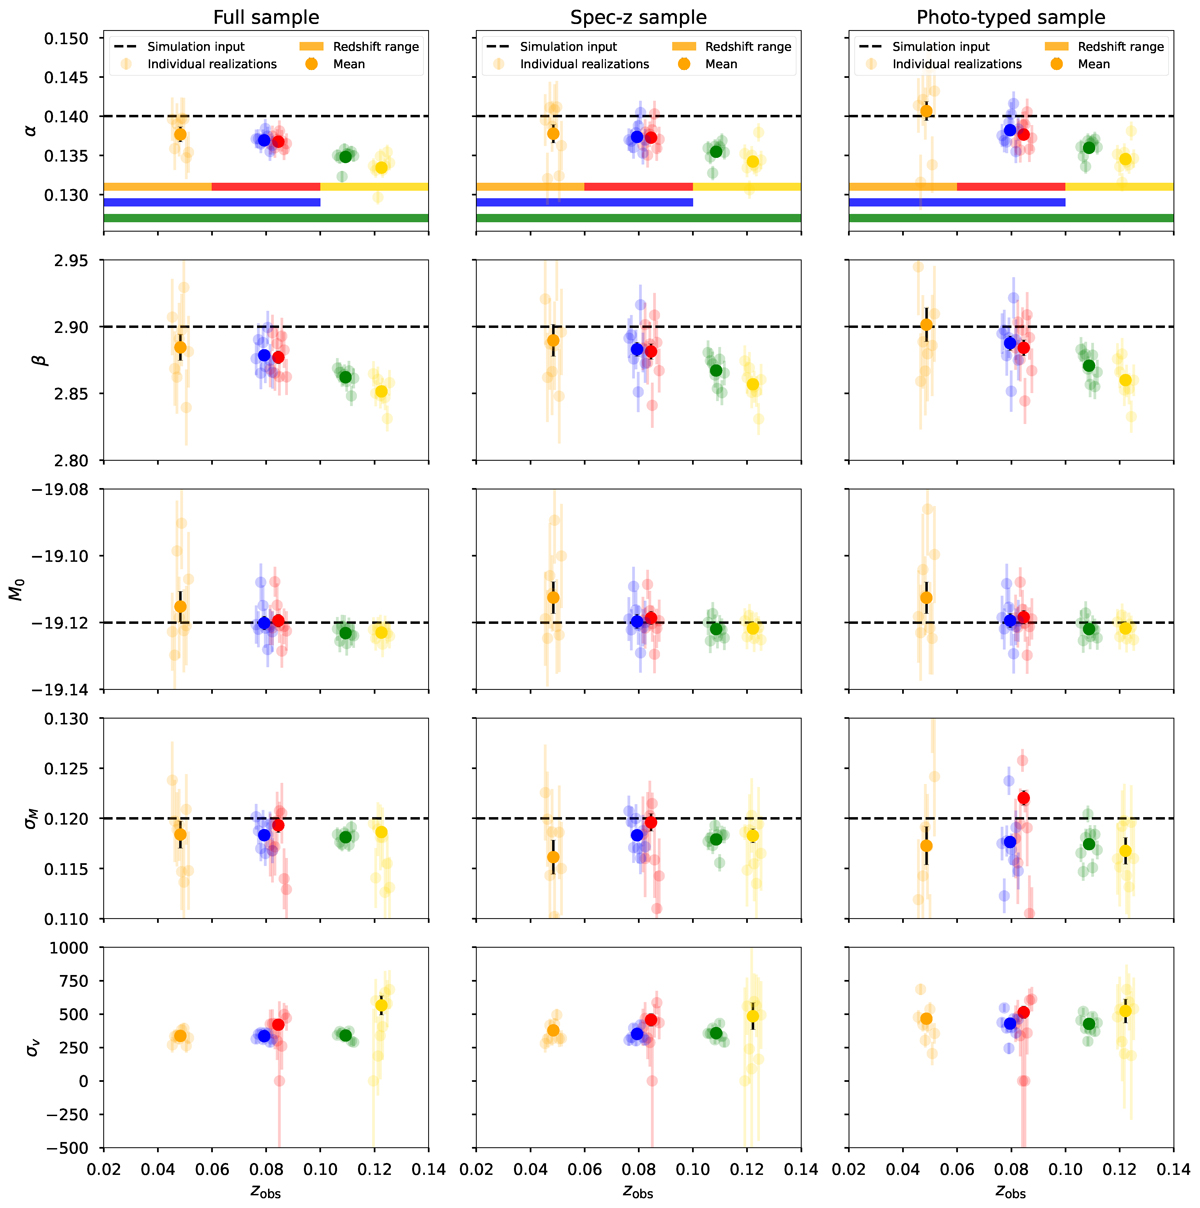
Fig. D.1.
Download original image
Result of HD parameter fits for all the scenarios in different redshift bins. Left: Full sample. Center: Spec-z sample. Right: Photo-typed sample. For each scenario, the top panel shows the results for α, then in order going down: β,M0, σM and σv. The results are shown for each of the eight LSST realizations together with the mean value. The averages are plotted at the mean redshift positions, while the results for the individual realizations are slightly shifted along the x-axis to improve the clarity of the figure. For each scenario, the black dotted line shows the value of the simulation input. The colored bars show the redshift range used for each fit, the bars have the same colors as the measurements.
Current usage metrics show cumulative count of Article Views (full-text article views including HTML views, PDF and ePub downloads, according to the available data) and Abstracts Views on Vision4Press platform.
Data correspond to usage on the plateform after 2015. The current usage metrics is available 48-96 hours after online publication and is updated daily on week days.
Initial download of the metrics may take a while.