Open Access
Fig. 3.
Download original image
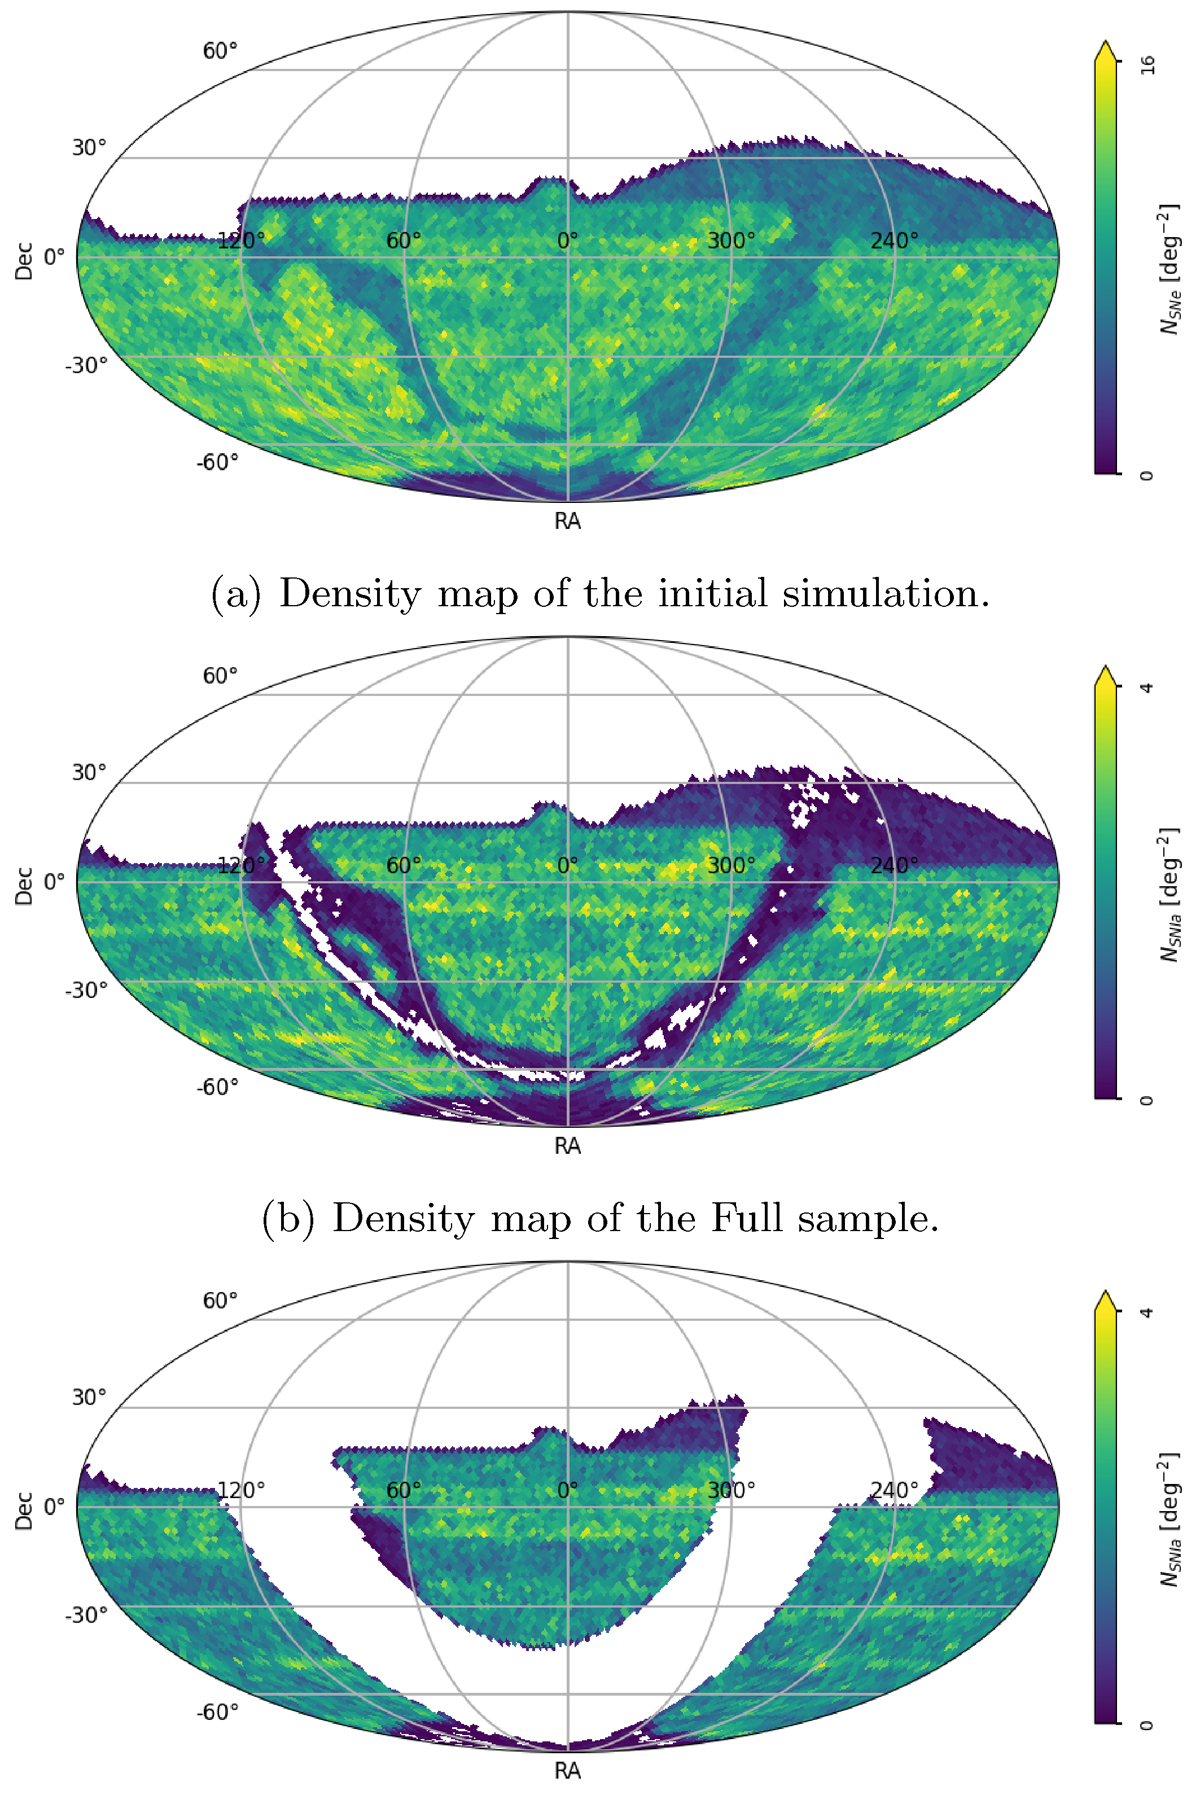
Density maps of the different SN Ia samples across the LSST footprint. SN density in the initial simulated sample (a), density of the Full sample (b), and density of the Spec-z sample (c). All the maps represent the average over the eight LSST realizations.
Current usage metrics show cumulative count of Article Views (full-text article views including HTML views, PDF and ePub downloads, according to the available data) and Abstracts Views on Vision4Press platform.
Data correspond to usage on the plateform after 2015. The current usage metrics is available 48-96 hours after online publication and is updated daily on week days.
Initial download of the metrics may take a while.